Markets Update: BTC Prices Suffer from a 65% Loss Since December

Bitcoin prices and cryptocurrency markets, in general, have been declining in value for the past six weeks straight with a few bounces here and there. Currently, BTC/USD markets have reached the lowest price in weeks touching $6,600 on February 5, 2018, erasing the past three months worth of gains.
Also Read: China Censors Cryptocurrency Ads on Search Engines and Social Media

The -65 Percent Bitcoin Dip
Many cryptocurrency enthusiasts and traders are in search of the cryptocurrency ‘bottom’ — the price position where the asset will go no lower and is usually followed by a price rise. Today BTC hit a low of $6,600 across most global exchanges around 2 pm EDT. At the moment the BTC/USD global average is hovering just above the $7,000 region after passing through the $9-8K territories two days prior. At the time of publication BTC markets are down -65 percent since the December 16 all-time high. Over the past 12-hours, trade volume has been weak at under $6Bn traded over the past 24-hours, but that metric has increased since the dip. The top five exchanges trading the most BTC at the moment include Bitfinex, Okex, Binance, GDAX, and Bitstamp. The Japanese yen is the most dominant currency traded right now with BTC as the yen captures 40 percent of global trading. This is followed by the USD (36%), tether (USDT 10%), the euro (7%), and the Korean won (2%).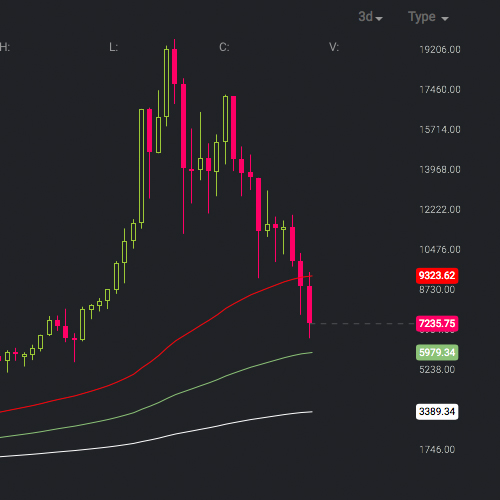 Three-day Bitstamp chart on February 5, 2018.
Technical Indicators
Looking at the daily, 4-hour, and 30-minute charts show blood is in the markets and there is a whole lot of sell-off happening. The two Simple Moving Averages (SMA) both short (100) and long-term (200) had seemed to be coming close to convergence. However, the two trend lines have spread once again, and the 100 SMA is sinking below the 200 SMA. This indicates the bearish sentiment is still in high gear for the time being. The Macd was barreling well below recovery territories as well, suggesting a high period of sell-off; however, after touching $6,600 volumes, it started to heat up.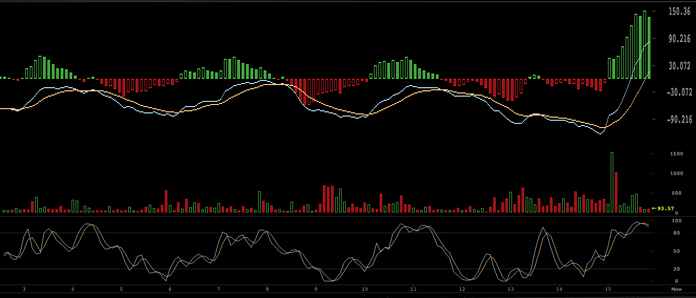 Macd and RSI/Stoch show a good rebound after touching the $6,600 region but it still could be a ‘dead cat bounce.’
The Relative Strength Index (RSI) and Stochastic oscillators show a bit of indecision at the time of publication as we may see some recovery in the short term. The current bounce back to $7,000 shows this may be the case. Order books across multiple exchanges show very little resistance towards the $7-8K price zones if bulls can muster up some strength. On the back side, foundations are relatively solid until $6,100 at that point, there is a steep buy wall the size of Mt Everest. However if this underpinning breaks then $5K price levels will likely be imminent.
Bitcoin prices and cryptocurrency markets, in general, have been declining in value for the past six weeks straight with a few bounces here and there. Currently, BTC/USD markets have reached the lowest price in weeks touching $6,600 on February 5, 2018, erasing the past three months worth of gains.
Also Read: China Censors Cryptocurrency Ads on Search Engines and Social Media
The -65 Percent Bitcoin Dip
Many cryptocurrency enthusiasts and traders are in search of the cryptocurrency ‘bottom’ — the price position where the asset will go no lower and is usually followed by a price rise. Today BTC hit a low of $6,600 across most global exchanges around 2 pm EDT. At the moment the BTC/USD global average is hovering just above the $7,000 region after passing through the $9-8K territories two days prior. At the time of publication BTC markets are down -65 percent since the December 16 all-time high. Over the past 12-hours, trade volume has been weak at under $6Bn traded over the past 24-hours, but that metric has increased since the dip. The top five exchanges trading the most BTC at the moment include Bitfinex, Okex, Binance, GDAX, and Bitstamp. The Japanese yen is the most dominant currency traded right now with BTC as the yen captures 40 percent of global trading. This is followed by the USD (36%), tether (USDT 10%), the euro (7%), and the Korean won (2%).Three-day Bitstamp chart on February 5, 2018.
Technical Indicators
Looking at the daily, 4-hour, and 30-minute charts show blood is in the markets and there is a whole lot of sell-off happening. The two Simple Moving Averages (SMA) both short (100) and long-term (200) had seemed to be coming close to convergence. However, the two trend lines have spread once again, and the 100 SMA is sinking below the 200 SMA. This indicates the bearish sentiment is still in high gear for the time being. The Macd was barreling well below recovery territories as well, suggesting a high period of sell-off; however, after touching $6,600 volumes, it started to heat up.Macd and RSI/Stoch show a good rebound after touching the $6,600 region but it still could be a ‘dead cat bounce.’
The Relative Strength Index (RSI) and Stochastic oscillators show a bit of indecision at the time of publication as we may see some recovery in the short term. The current bounce back to $7,000 shows this may be the case. Order books across multiple exchanges show very little resistance towards the $7-8K price zones if bulls can muster up some strength. On the back side, foundations are relatively solid until $6,100 at that point, there is a steep buy wall the size of Mt Everest. However if this underpinning breaks then $5K price levels will likely be imminent.


