The Ultimate Spot Investor’s Playbook: Mastering Simple Yet Powerful Technical Analysis Strategies

Assalamu Alaikum. How are you all? I hope everyone is doing well.
By looking at the title, you have probably already understood what today's discussion is about.
Yes, today we will learn about very simple but important Technical Analysis and some strategies.
After this discussion, you will not need to keep searching YouTube or other social media platforms again and again to watch videos, and you will not have to deal with complicated strategies that create mental pressure.
By using simple chart analysis and strategies, you can apply them comfortably and work toward success.
So, let's dive into the discussion.
What is Technical Analysis?
First, we need to understand what Technical Analysis actually is.
Look, many writers and publishers explain it in complicated ways and use too many examples, so people understand half and miss the other half.
I will explain it in just one or two simple lines.
Simply put, Technical Analysis is the process of understanding a chart by observing market movement and using different indicators or technical tools together to find signals and make decisions about the right time to enter and exit the market.
Imagine that you are looking at a chart.
Now, the chart you are seeing can either go up or go down.
But you do not know the future, so you do not know which direction the market will move.
That is why you use more than one technical tool or indicator.
These tools mainly work through mathematical calculations and market emotions to give a final signal.
When you notice that most of the tools are pointing in the same direction, then you take your entry based on that result.
This whole process is called Technical Analysis.
Now you understand the idea, right?
So, let's move on and look at some important but simple technical strategies.
[Note: Today's article is for Stock and Spot Market holders, so other types of traders should not follow these instructions.]
Volume + RSI (RSI) Strategy
First, let's talk about the Volume + RSI strategy.
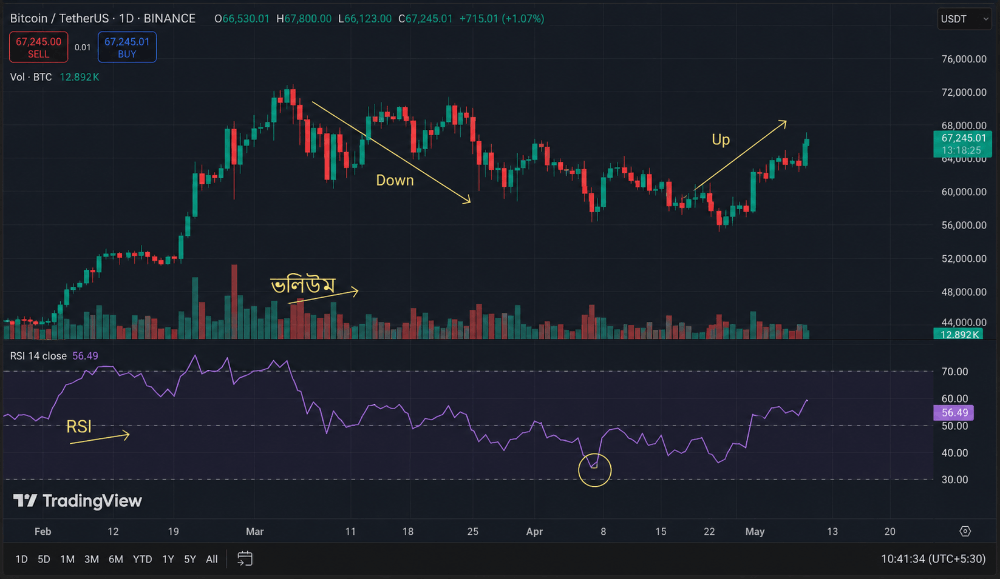
You have probably understood the basic idea from the image above.
If you look carefully, you will notice one thing: when the market goes down, the RSI level usually moves below 40 and starts finding its bottom area. Volume also shows a similar pattern.
When RSI goes below 40, volume usually increases, meaning more red volume appears.
When this happens, according to this strategy, you may consider that the market is finding its bottom.
At that point, you take an entry.
The idea here is that whenever the market reaches RSI 40 or even 30, it may eventually recover and move upward again, whether quickly or slowly.
Then, while RSI is still below 40, if you suddenly notice a green volume bar—small or large—you may think that the market is preparing to move upward.
Because of that, you take another entry, which may help you gain a better profit.
For exiting the market, first wait until the market reaches RSI 70+ (the Overbought zone).
When it reaches that area, do not exit immediately, because the market may continue moving higher.
Instead, after RSI goes above 70, if you notice strong green volume again, then you can start taking profit gradually.
After that, if you suddenly see a red volume bar, whether small or large, you may consider that the market could begin correcting or moving down.
At that point, according to this strategy, you exit completely.
You may think that volume only depends on whether the bars are bigger or smaller.
For example, you may believe that if there is one large red volume, then the market will stay down until a green volume equal to or larger than that appears.
Yes, at first it may seem like that.
But according to this explanation, this way of thinking is one reason why many people do not use volume correctly.
I hope the idea was easy to understand.
RSI + Moving Average
I consider this strategy one of the easiest strategies.
Because these two indicators are among the most powerful and reliable tools in chart analysis.
Now let's see how to use it.
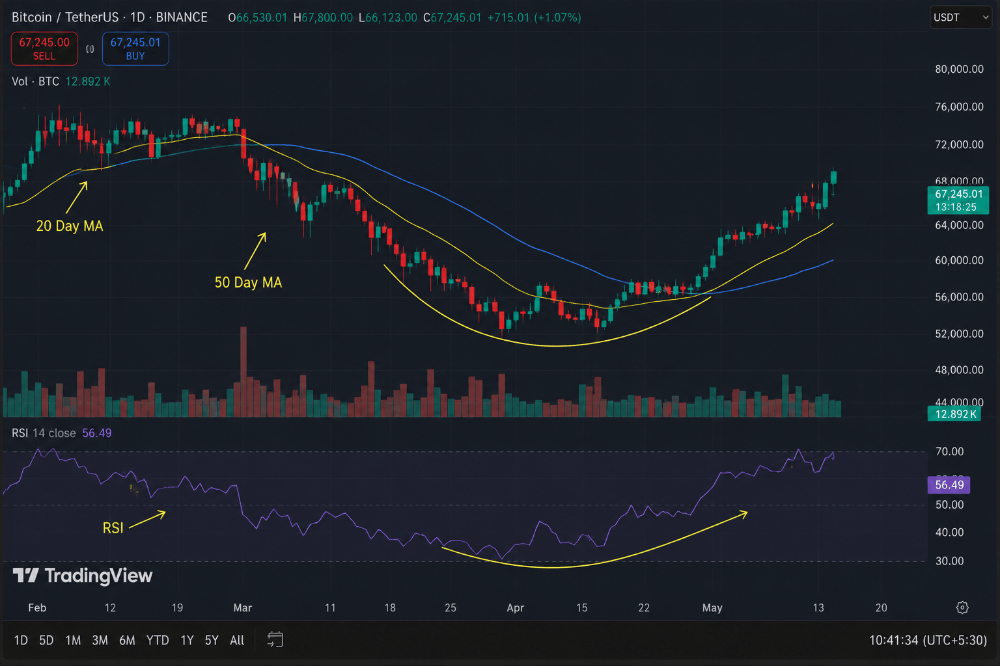
Look at one thing carefully.
When the market moved below RSI 40, at the same time the 50 MA line crossed the 200 MA line from top to bottom.
It is important to mention that the 200 MA line works as a strong support.
Usually, the 200 MA can work as both support and resistance.
You just need to understand when it is acting as support and when it is acting as resistance.
When RSI moves below 40 or 30, meaning the market has found its bottom, the 200 MA works as support.
This means the market takes support there and starts moving upward again.
Sometimes the market breaks below the 200 MA and moves down. According to this strategy, that can become a strong reversal signal.
Just like in the image.
When the 50 MA crossed below the 200 MA, the market started finding a strong bottom and preparing for a reversal.
The RSI then confirmed this movement.
Right when RSI started moving above 40 again, the reversal gained strength and the 50 MA crossed back above the 200 MA.
During this period, you can take entries using the DCA method three times.
First entry:
When RSI goes below 40 and the cross appears.
Second entry:
When the 50 MA crosses the 200 MA from top to bottom.
Third entry:
When the 50 MA crosses back above the 200 MA.
And make sure you do not enter during the candle where the signal appears.
Instead, wait for that candle to close and enter after the next candle opens.
According to this approach, that increases confirmation.
For exits, follow the same logic.
First exit:
When RSI reaches 70+.
Second exit:
When the 50 MA crosses the 200 MA from bottom to top.
Third exit:
When the 50 MA crosses the 200 MA from top to bottom again.
At that point, take a complete exit.
Remember:
At that stage, the 200 MA is no longer acting as support—it becomes resistance.
RSI + Double Top and Double Bottom
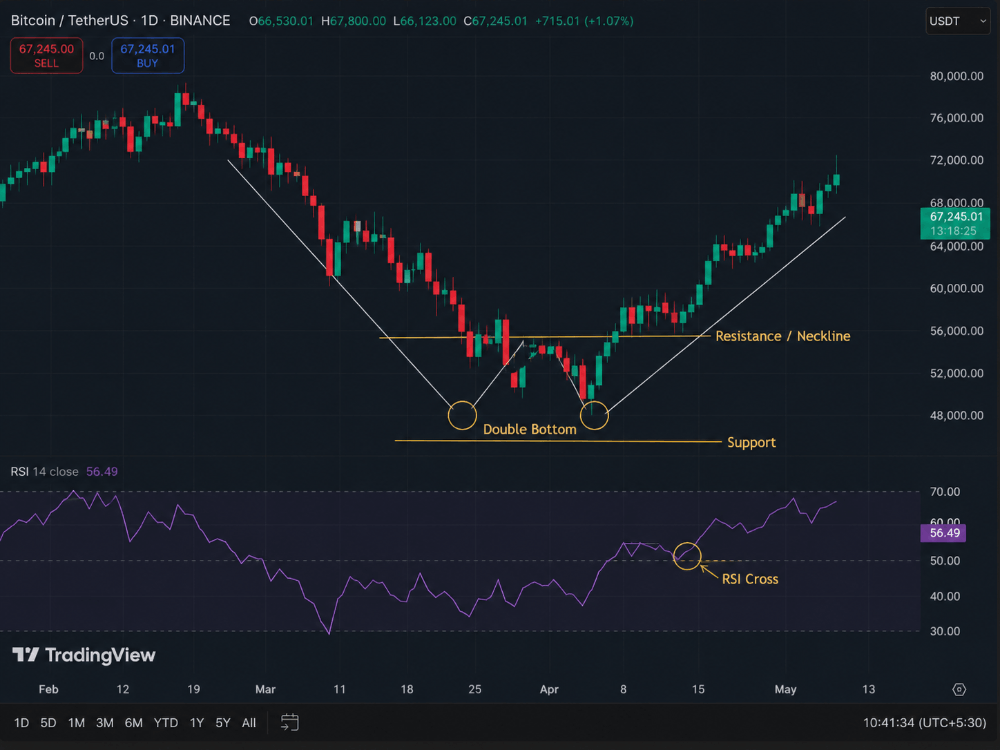
First, let's talk about the Double Bottom or W Pattern.
As you can see, when the market moved below RSI 40 or 30, a W Pattern appeared.
This pattern mainly works as support and resistance.
If you look carefully, you will notice that the two large bottoms of the pattern stay around the same level and create a support zone.
And just above these two bottoms, a resistance level is formed.
Since this resistance line forms near the market bottom, meaning when RSI is below 40 or 30, once the market breaks that resistance, according to this strategy, it becomes a strong reversal signal.
At the same time, the RSI level also crosses above 40 from below.
Since two strong tools are giving the same signal, according to this strategy, you can confidently take an entry.
Now the question is: where should you enter?
Using the DCA method:
First entry:
When the market starts moving below RSI 70 and crosses downward.
Second entry:
While RSI stays below 40 or 30, take entries around the two bottoms.
Third entry:
When the market breaks above the resistance level created above the two bottoms.
More specifically, enter after the candle that makes the breakout closes, and enter from the next candle.
So in total, you can take three entries.
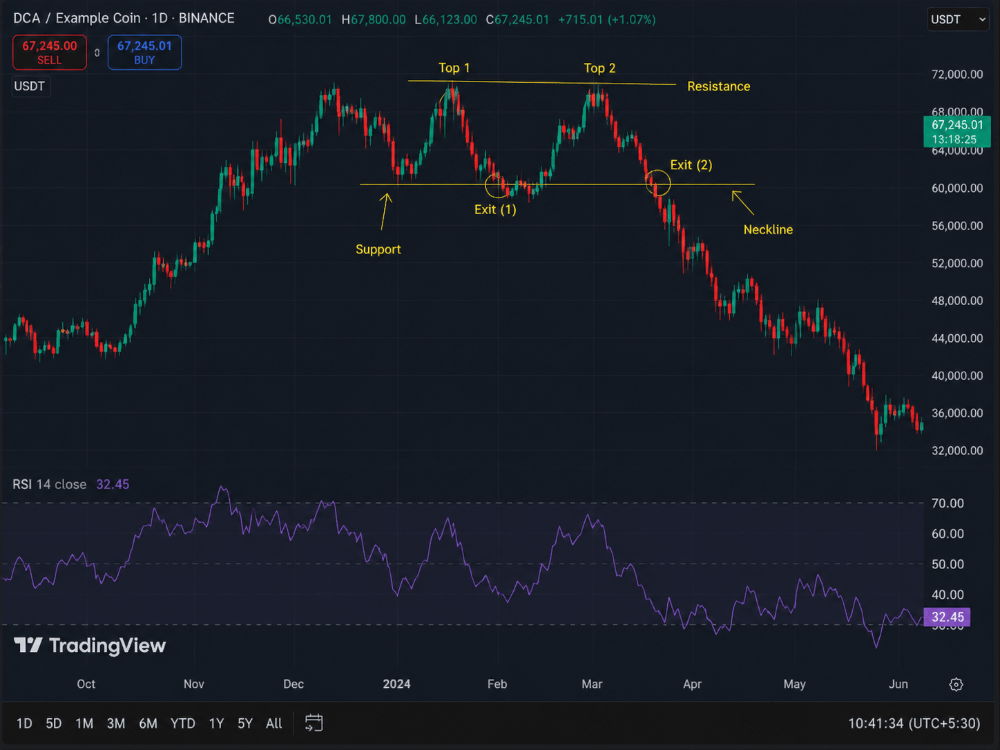
Now the Double Top or M Pattern works in the opposite way.
For Double Top, you can take exits in four stages.
First stage:
When RSI crosses above 70 for the first time.
Second stage:
When the first top touches the resistance level.
Third stage:
When the second top touches the resistance level.
Fourth and final stage:
When RSI crosses back below 70 and the market also breaks below the support level of the M Pattern.
According to this strategy, you then take a complete exit.
If you follow this strategy properly, InshaAllah you may get good results.
**[Note: Never use this on short-term timeframes. Use it on long-term charts such as Weekly or Monthly charts. Also, draw charts manually and sometimes use technical chart tools so that patterns become easier to identify.]**
Moving Average + Volume
This strategy is considered one of the most classic and clean technical analysis strategies in chart analysis.
Although many professional chart analysts say that this strategy is better for old and experienced traders and recommend beginners not to use it.
You will understand the reason in a moment.
When the market’s 50 MA crosses below the 200 MA, according to this strategy, the market has found its bottom.
So naturally, it prepares for a reversal.
Then when it crosses back from below to above, the market becomes stronger and starts recovering.
So according to this strategy, you take entries in two stages.
First Stage:
When the market’s 50 MA makes the first cross, check whether the volume is green.
This means after the candle that crosses the 200 MA closes, watch whether the next candle or any later candle shows green volume.
It could be the next candle, the second candle after it, or even ten candles later.
Whenever the first green volume appears after the closing, take your entry.
Second Stage:
When the second crossing happens, again enter only if the volume is green.
Exit:
For exit, when the market moves very high and reaches resistance, eventually it may break below the 200 MA support.
Then the 200 MA changes from support into resistance.
When that happens, take your exit.
Risk:
As I said before, this strategy looks simple but in reality it is difficult.
Because only if you understand candles properly can you decide whether the 200 MA is acting as support or becoming a strong reversal point.
With Moving Average alone, usually you can mainly identify support and resistance.
So understanding which cross means Buy and which means Sell becomes difficult.
RSI helps because it shows where the market found its bottom and where it became overbought.
That is why Moving Average becomes easier when used together with RSI.
But volume alone does not show that.
With volume, at best, you can estimate reversal or exit timing, but there is no full guarantee.
Because volume can increase not only due to reversal or overbought conditions but also because whales may create pump and dump movements.
And according to this explanation, without RSI those pump and dump situations are harder to recognize.
So according to this view, I would suggest staying away from using this strategy alone.
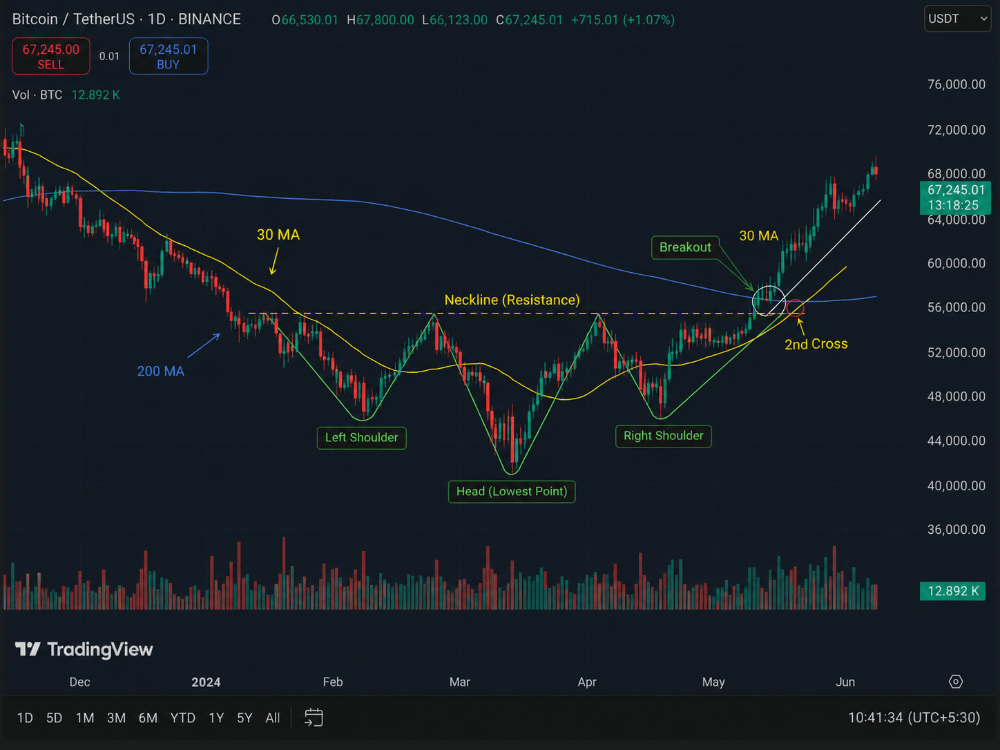
Head and Shoulder + RSI
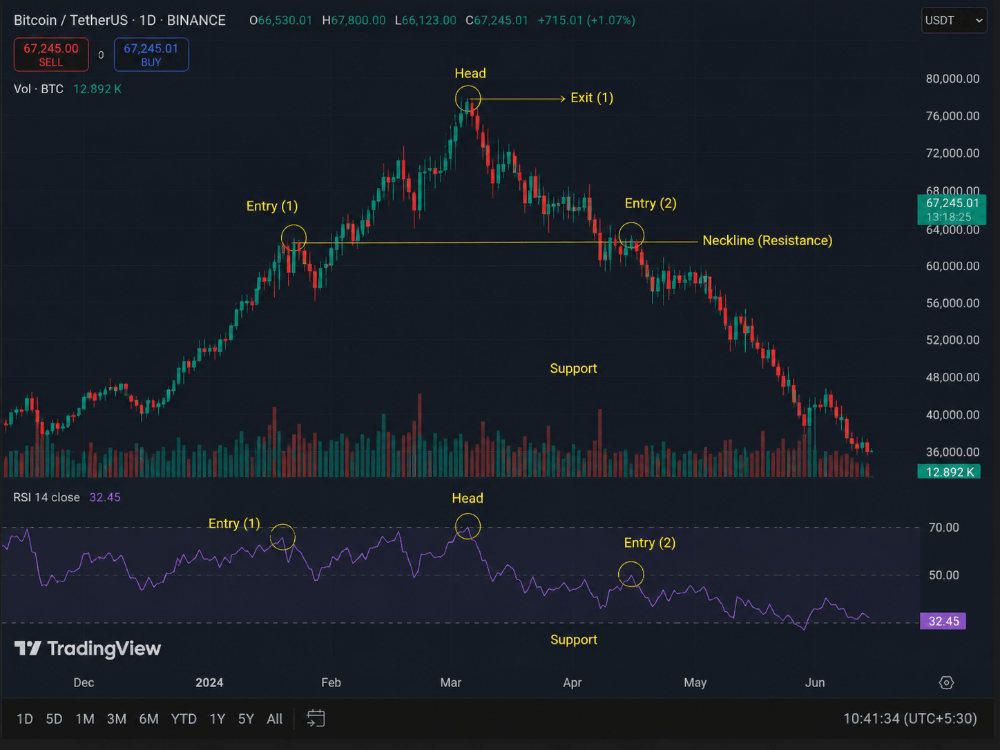
type:1
type:2
From the name itself, you can understand that this pattern looks like our head and two shoulders.
This pattern is often considered one of the strongest and most accurate chart patterns.
It is not only used in Spot or Stock markets but also in many other trading fields.
Head and Shoulders mainly has two types:
- Head and Shoulders (Image 1)
- Inverted Head and Shoulders (Image 2)
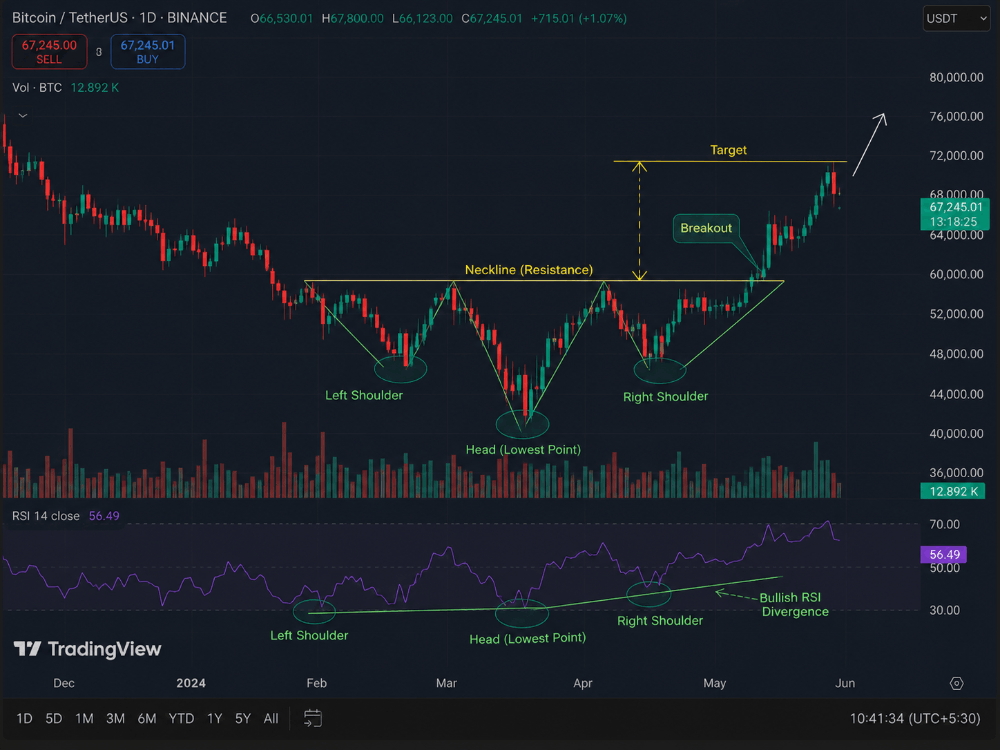
First, let's talk about the Inverted Head and Shoulders.
When the market moves below RSI 40 or 30, according to this strategy the market finds its bottom and this pattern starts forming.
Here you can take entries in 3 stages using the DCA (Dollar Cost Average) method.
Inverted Head and Shoulders (3 Stages)
First Stage:
When RSI moves below 40 and the pattern starts creating the first shoulder by crossing the resistance level from top to bottom.
Second Stage:
When the head forms and touches the support level.
Third Stage:
When RSI crosses above 40 from below and at the same time the second shoulder becomes complete and the pattern breaks above resistance.
For the normal Head and Shoulder pattern, use the opposite idea.
When the market reaches the overbought zone and the Head and Shoulder pattern forms, take your exit.
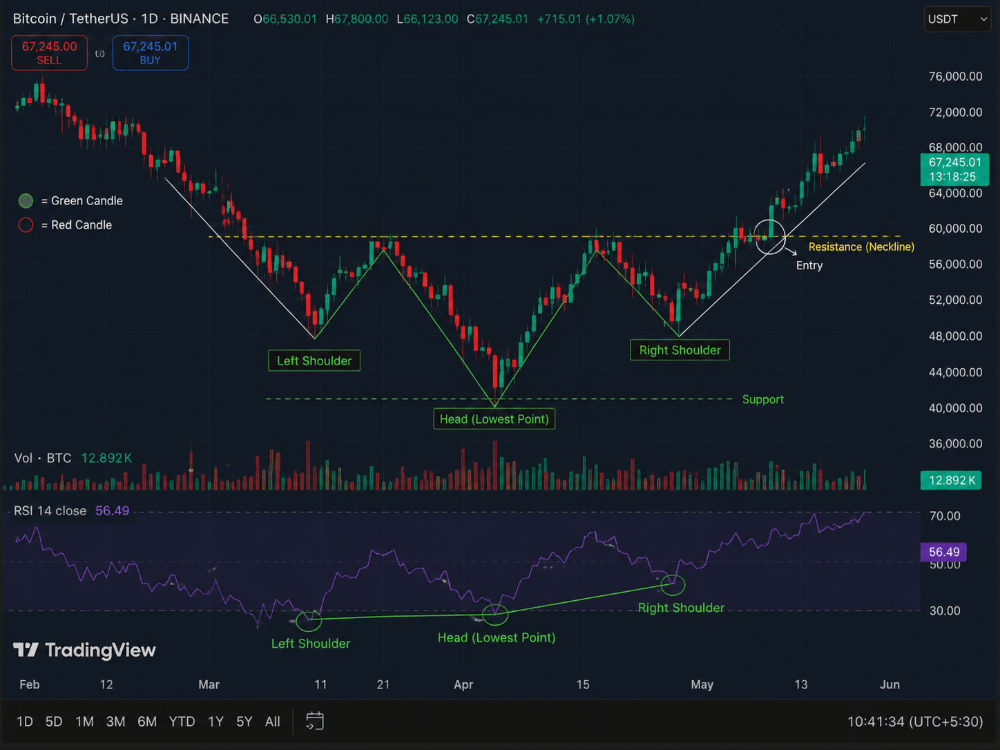
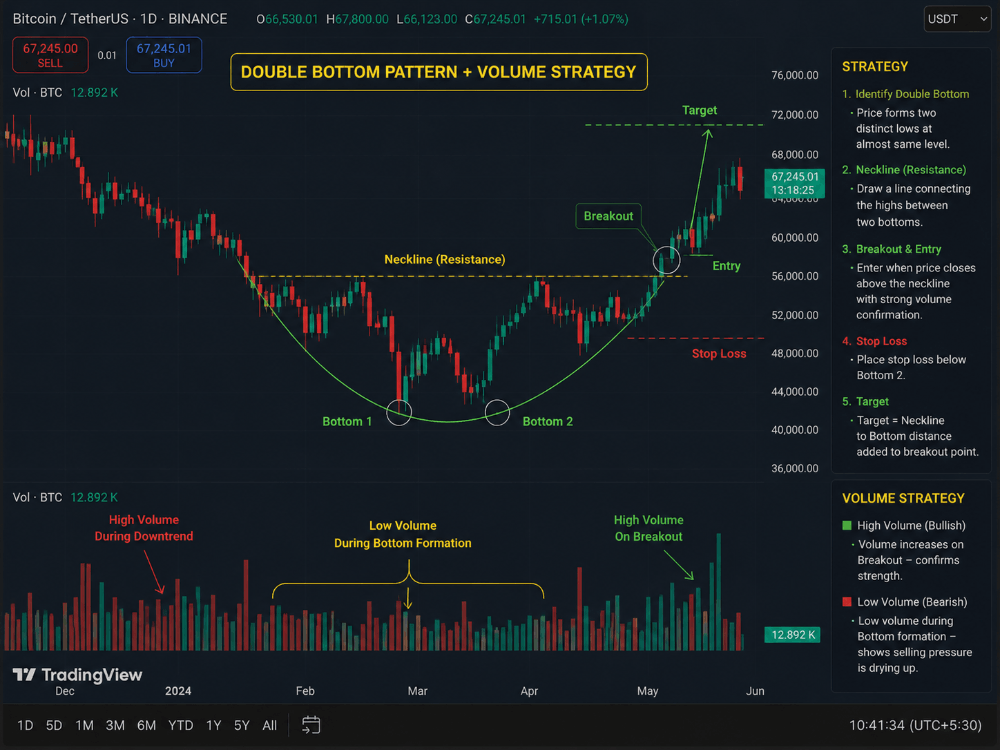
Chart Pattern + Volume
If you look carefully here, you will notice that when the market finds its bottom, this Double Bottom pattern appears.
Whenever you see this type of pattern on your chart, understand that the market may be preparing for a reversal.
The reason is that the two bottoms of this pattern create a strong support level, and above them a resistance level is formed.
Since the market is reversing after finding its bottom, breaking the resistance means the reversal becomes stronger and the market may move upward.
Now the question is, how do you take entry?
That is where volume becomes important.
Basically, there is one main way to take entry.Look carefully at the chart. When the pattern becomes fully formed, meaning both bottoms are completed, the market breaks the resistance level.
That means it crosses from below to above.
After that candle closes, check its volume.
If the volume is green and large, then take entry on the next candle.
In the same way, when a Double Top forms, understand that the market has moved very high and entered an overbought zone.
So it may start correcting or moving downward.At that time, take exit around the first or second top.
The same method can also be used for other chart patterns.
Meaning, take entry by watching the crossing candle and the volume.
MA + Chart Patterns
This works almost the same way as Volume + Chart Pattern.
The only difference is that instead of volume, the 50 MA must cross the 200 MA.
That means when a candle breaks the resistance level in any pattern, do not enter immediately.
Because MA crossing usually happens a little later.When the 50 MA crosses the 200 MA from below to above, enter from the next candle after the crossing candle.
And in the same way, if you see a reversal pattern, take exit using resistance crossing and MA crossing.
For easier understanding, below is an example of a pattern with MA crossing combination.

Final Words / Summary
I am not someone who can give a 100% guarantee.I only shared an idea.
I researched these strategies and found that on long-term charts their accuracy can be very high.
According to this view, they may give around 80–90% profit.
But you should always use your own knowledge first.
Because something that works with my understanding may work differently for you.
If you use these strategies, combine them with your own strategy and knowledge.
That may increase the accuracy for your own case.
Also, there are many other strategies in the world that may feel difficult to me but easy for you.
So I only showed the ones I think are important and simple.
If you prefer other strategies, feel free to use those.
I hope I was able to explain the topic clearly.
If you want to know anything else, feel free to ask in the comments.
Assalamu Alaikum.