ORDI Price Prediction

- 1 ORDI price chart shows the higher highs formation and a surge.
- 2 Buyers are gaining traction and are accumulating steadily.
ORDI price chart saw a double bottom breakout above $70 this month. Moreover, the ORDI token deals with a bullish sensation and is anticipated to reach the $100 mark. Amid the pullback, ORDI price has surged by 60% and is still close to the 52-week high of $84, which the buyers are keen on escaping.
ORDI price is trading in the bullish trajectory above the key moving averages and depicts an uptrend on the chart. Moreover, the price action displays a higher high formation and suggests that the ORDI price will continue to accumulate gains. Per the Fibonacci extension tool, the ORDI price is trading above the neutrality and if it escapes the $85 mark, it will rise toward $88 and $93 in the following sessions.
The live price of the ORDI token is $81.01, with an intraday gain of 5.48%, showing bullishness on the chart. Moreover, the trading volume increased by 37.78% to $639.78 Million. However, the pair of ORDI/BTC is at 0.00192 BTC, and the market cap is $1.73 Billion. Analysts have maintained a bullish rating, suggesting the ORDI will continue outperforming in the following sessions.
ORDI on Daily Chart Displays Double Bottom Breakout
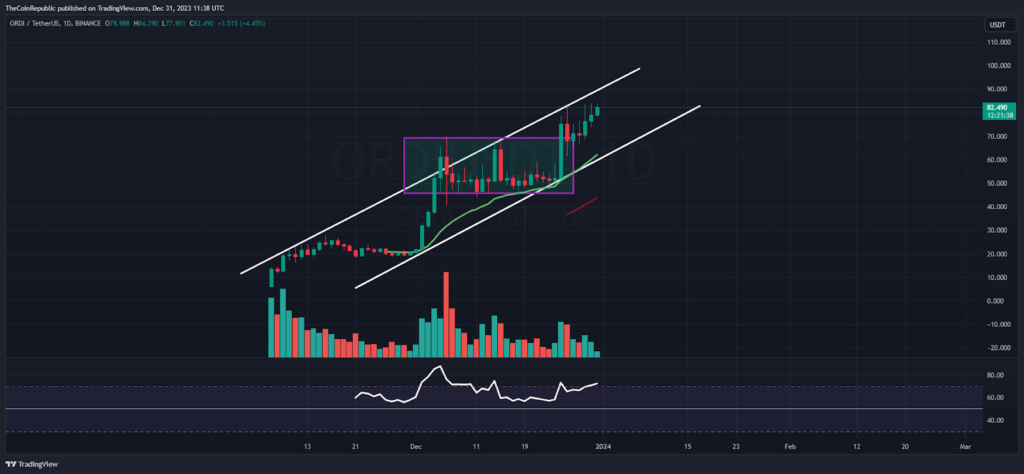
Source: ORDI/USD Chart By TradingView
On the daily chart, ORDI price is skyrocketing the gains and is heading to reach the psychological round mark of $100. The trend is strong, and the ORDI token is all set to claim the sweet spot in the upcoming sessions. Additionally, the pullback from the 20-day EMA mark trapped the bear cartel badly, resulting in a breakout above $70.
The relative strength index (RSI) curve stayed in the overbought zone near 72, forming a positive crossover and directing the range breakout on the charts. The MACD indicator showed a bullish crossover and formed green bars on the histogram, suggesting that a short-term rally will continue in the upcoming sessions.
ORDI on Weekly Chart Forms Bullish Marubozu Candlestick
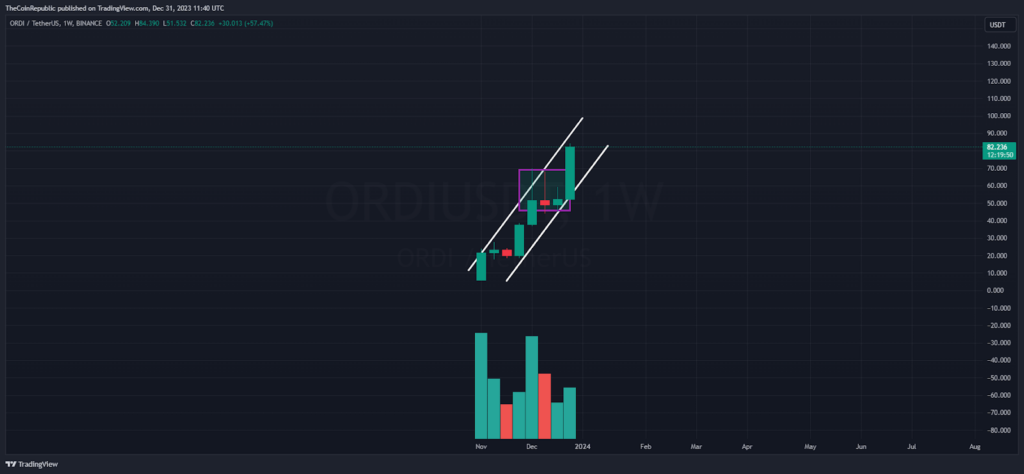
Source: ORDI/USD Chart by TradingView
The ORDI token waited for headways near the $70 mark on the weekly chart and formed a doji candlestick in recent sessions. Afterwards, a substantial u-turn from the channel’s lower trendline was documented and a bullish marubozu candlestick was formed, highlighting the buyers’ resilience.
Summary
ORDI token price fled the neckline of $70 and witnessed a double-bottom breakout, highlighting buyers’ resilience on the charts. Moreover, the trend is robust and prefers the bulls for a short-term mobilization toward $100 in the upcoming sessions. Additionally, the follow-on buying momentum has persisted in the last few weeks, giving a strong indication that investors are interested.
Technical Levels
Support Levels: $75 and $68
Resistance Levels: $85 and $92
Disclaimer
The views and opinions stated by the author or any other person named in this article are for informational purposes only and do not constitute financial, investment, or other advice. Investing in or trading crypto or stocks comes with a risk of financial loss.