Solana (SOL) Price Breaks Down From 100-Day Support -Where Will It Bottom? & Bitcoin Drops Below $40

In Brief
- Solana's (SOL) price has been descending since reaching a high of $126 on December 26, 2023.
- The daily and six-hour timeframes both give a bearish reading, supporting the ongoing decrease.
- Despite the bearish SOL price prediction, reclaiming the triangle's support line will be bullish.
- PROMO
- Take advantage of AI to diversify your investment portfolio.Empower your strategy with AlgosOne
 The Solana (SOL) price broke down from an ascending support trend line that was in place for nearly 100 days.
SOL also broke down from a short-term symmetrical triangle, falling below a Fibonacci support area.
Solana Breaks Down From Long-Term Support
The technical analysis from the daily time frame shows that SOL has increased alongside an ascending support trend line since October 16, 2023. The increase led to a high of $126 on December 25. This was a new yearly high.
However, the SOL price has fallen since. On January 19, 2024, it broke down from the ascending support trend line. At the time, the trend line had been in place for 96 days. Currently, SOL trades inside the 0.382 Fib retracement support level.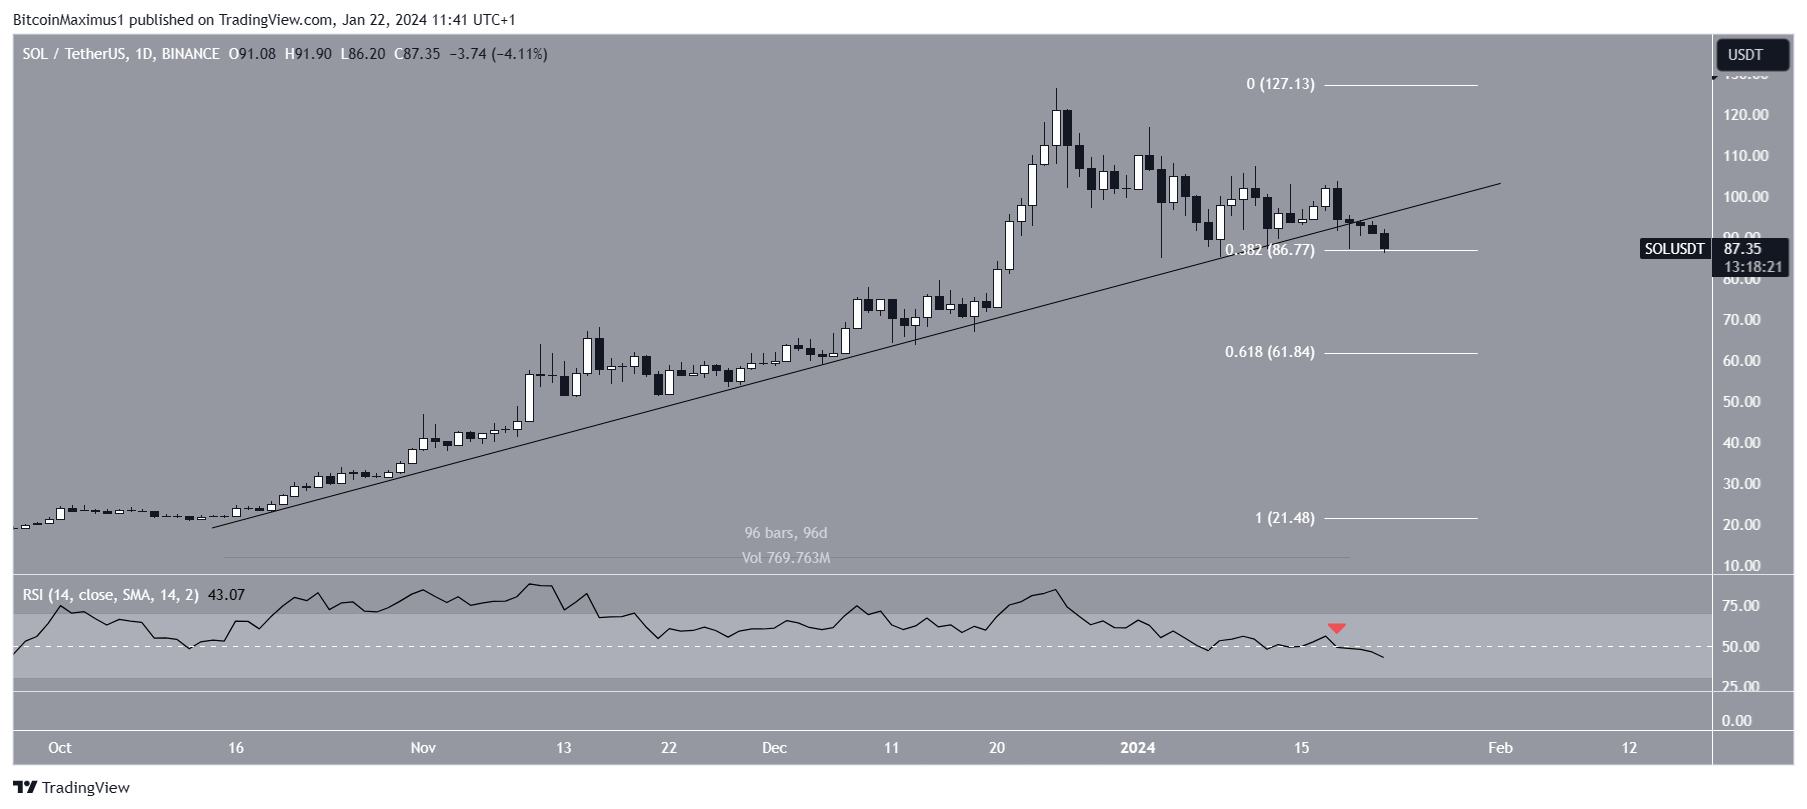 SOL/USDT Daily Chart. Source: TradingView
The daily RSI gives a bearish reading. When evaluating market conditions, traders use the RSI as a momentum indicator to determine whether a market is overbought or oversold and whether to accumulate or sell an asset.
If the RSI reading is above 50 and the trend is upward, bulls still have an advantage, but if the reading is below 50, the opposite is true. The indicator is below 50 and falling (red icon), both signs of a bearish trend.
Read More: How to Buy Solana (SOL) and Everything You Need to Know
What do Analysts Say?
Cryptocurrency traders and analysts on X have a predominantly negative view of the future SOL trend.
Lmn12121 is bearish, suggesting that the SOL price will fall to $70.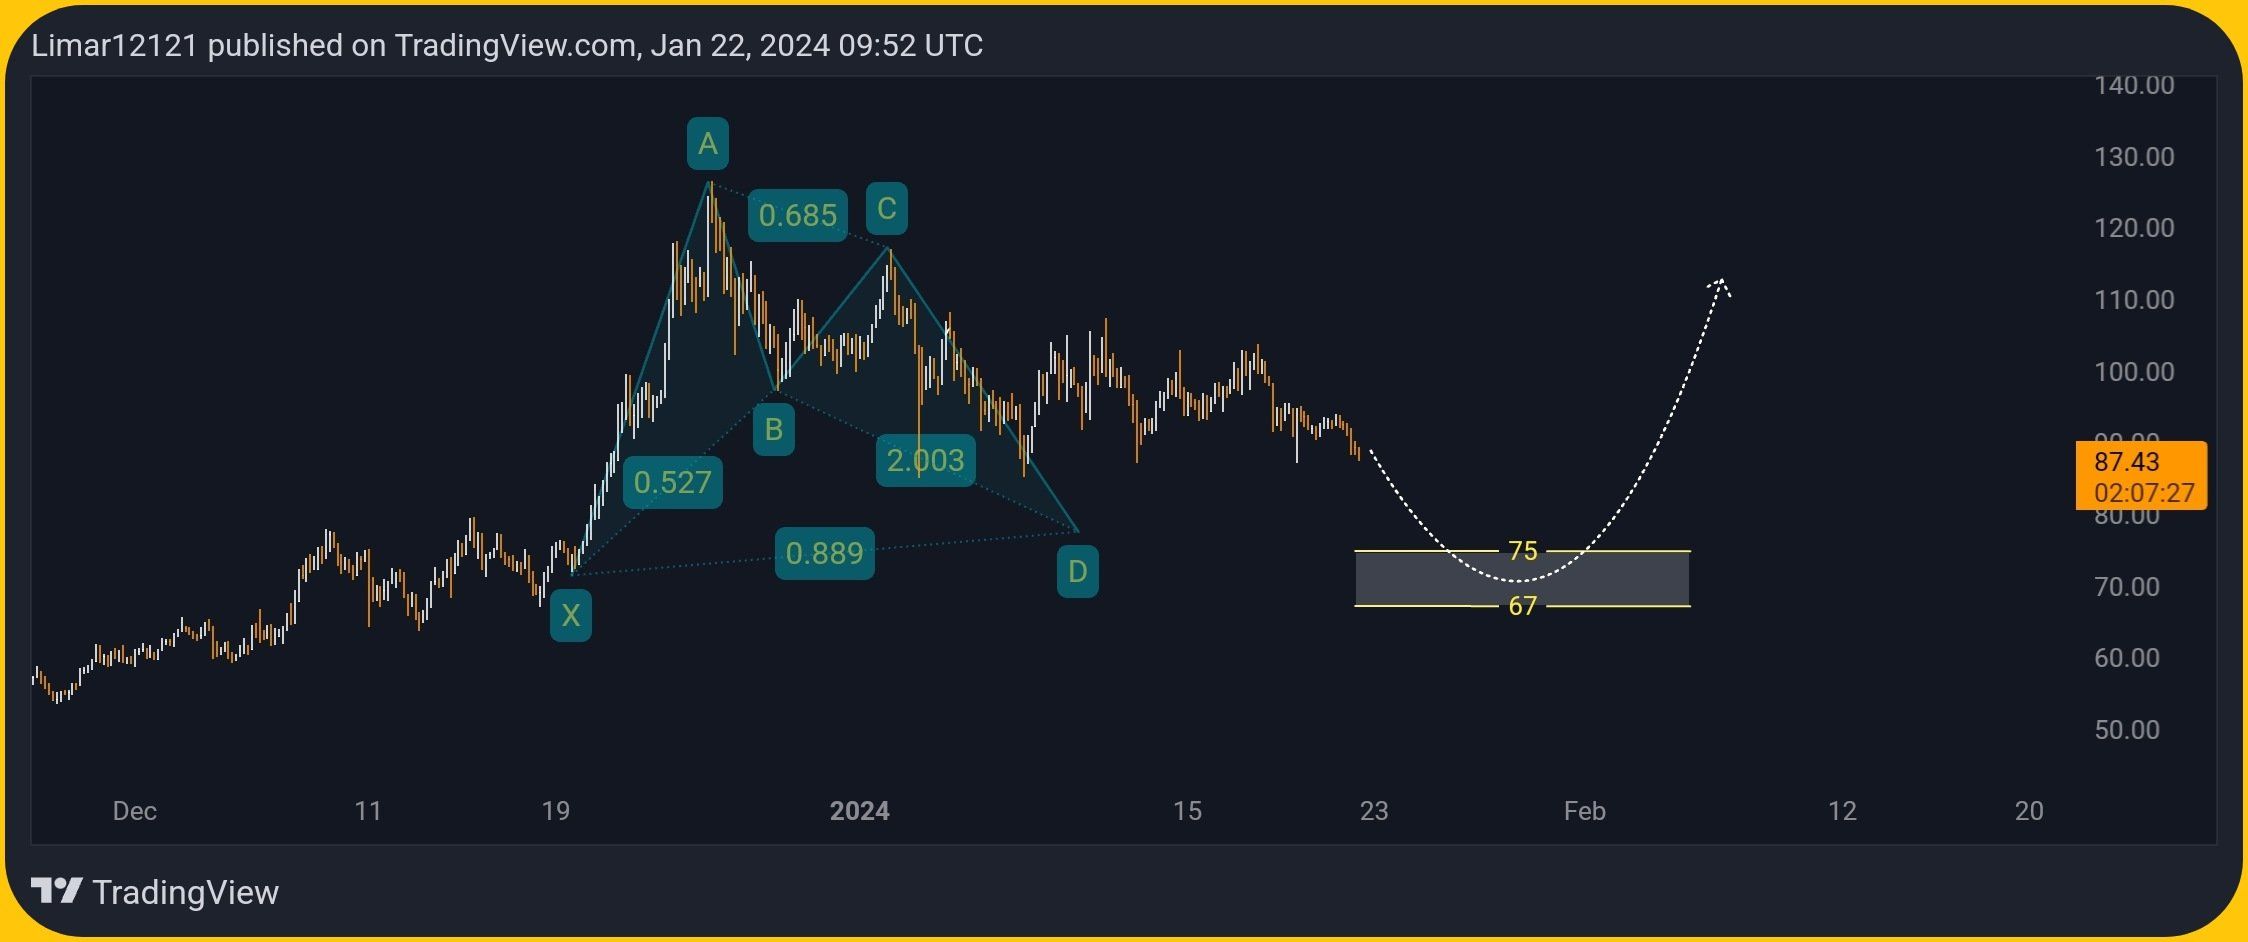 SOL/USDT Six-Hour Chart. Source: X
The Lord of Entry noted the breakdown from the ascending support trend line, tweeting:
$SOL Daily – #SOLUSDT looking a bit bearish here with the loss of trend from October, candle closes below this current support and the 77 region starts looking like a thing
Finally, BluntzCapital noted a fractal with the Bitcoin (BTC) price in 2018. He suggested that while SOL is likely to fall to $70, this will mark a long-term bottom.
Read More: Top 6 Solana Projects With Massive Potential
SOL Price Prediction: When Will the Correction End?
Similarly to the daily time frame, the six-hour one gives a bearish reading. This is because of the price action, RSI, and Elliott Wave count.
Technical analysts employ the Elliott Wave theory to identify recurring long-term price patterns and investor psychology, which helps them determine the direction of a trend.
Read More: What Is Solana (SOL)?
The most likely count suggests that SOL is in the C wave of an A-B-C corrective structure. The B-wave took the shape of a triangle, common in such corrective waves.
The price action shows that SOL broke out from the symmetrical triangle, confirming the correction. Additionally, the RSI is below 50 and falling, both signs if a bearish trend.
If the decrease continues, SOL can fall another 20% to a confluence of supports between $70-$72. A horizontal support area creates the support, the 0.618 Fib retracement support level, and the triangle’s height projected to the breakdown level.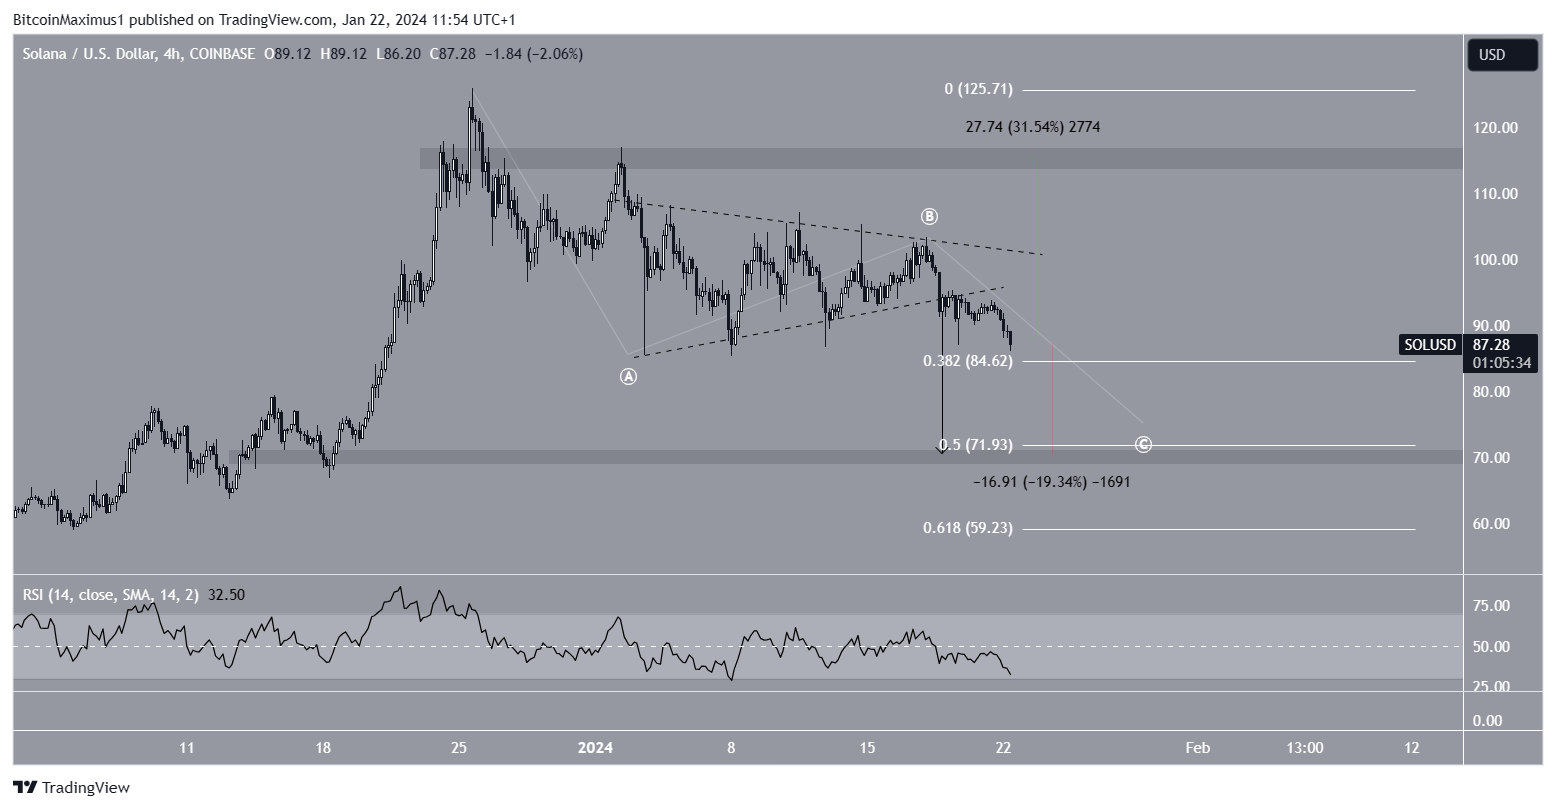 SOL/USDT Six-Hour Chart. Source: TradingView
Despite this bearish Solana price prediction, reclaiming the triangle’s support trend line will mean the correction is over. Then, SOL can increase 30% to the next resistance at $115.
For BeInCrypto’s latest crypto market analysis, click here.
DISCLAIMER
In line with the Trust Project guidelines, this price analysis article is for informational purposes only and should not be considered financial or investment advice. BeInCrypto is committed to accurate, unbiased reporting, but market conditions are subject to change without notice. Always conduct your own research and consult with a professional before making any financial decisions. Please note that our Terms and Conditions, Privacy Policy, and Disclaimers have been updated.
Bitcoin Drops Below $40K But These 3 Things Will Limit Downsides
In Brief
- Bitcoin's downside is limited by three factors: influx of institutional investment via Bitcoin ETFs and crypto market cycles.
- Despite outflows from Grayscale Bitcoin Trust, around $1.1 billion worth of BTC has been bought since ETF launches.
- The halving event in late April or early May, which will cut new supplies of BTC by half, will also limit Bitcoin's downside.
- PROMO
- Take advantage of AI to diversify your investment portfolio.Empower your strategy with AlgosOne
 Bitcoin prices have dipped below the psychological $40,000 level as the crypto market correction deepens. However, the downsides may be limited due to a number of factors according to financial ratings firm Weiss.
On January 23, Bitcoin prices tumbled below $40,000 hitting an intraday low of $39,494 during the Tuesday morning Asian trading session.
Bitcoin Correction Continues
However, on January 22, Weiss Crypto stated that even if Bitcoin continues to slide for the rest of this month, the downside will be limited by three things.
Firstly, the influx of institutional investment via spot Bitcoin ETFs will limit downsides, it stated.
“The tremendous power of new capital flowing into crypto from traditional investors who can now access Bitcoin via the 11 new ETFs issued by the biggest players on Wall Street.”
Despite the outflows from the Grayscale Bitcoin Trust (GBTC), 27,717 BTC has been bought since ETF launches on a net basis, reported CC15Capital on Jan. 23. That equates to around $1.1 billion at current prices.
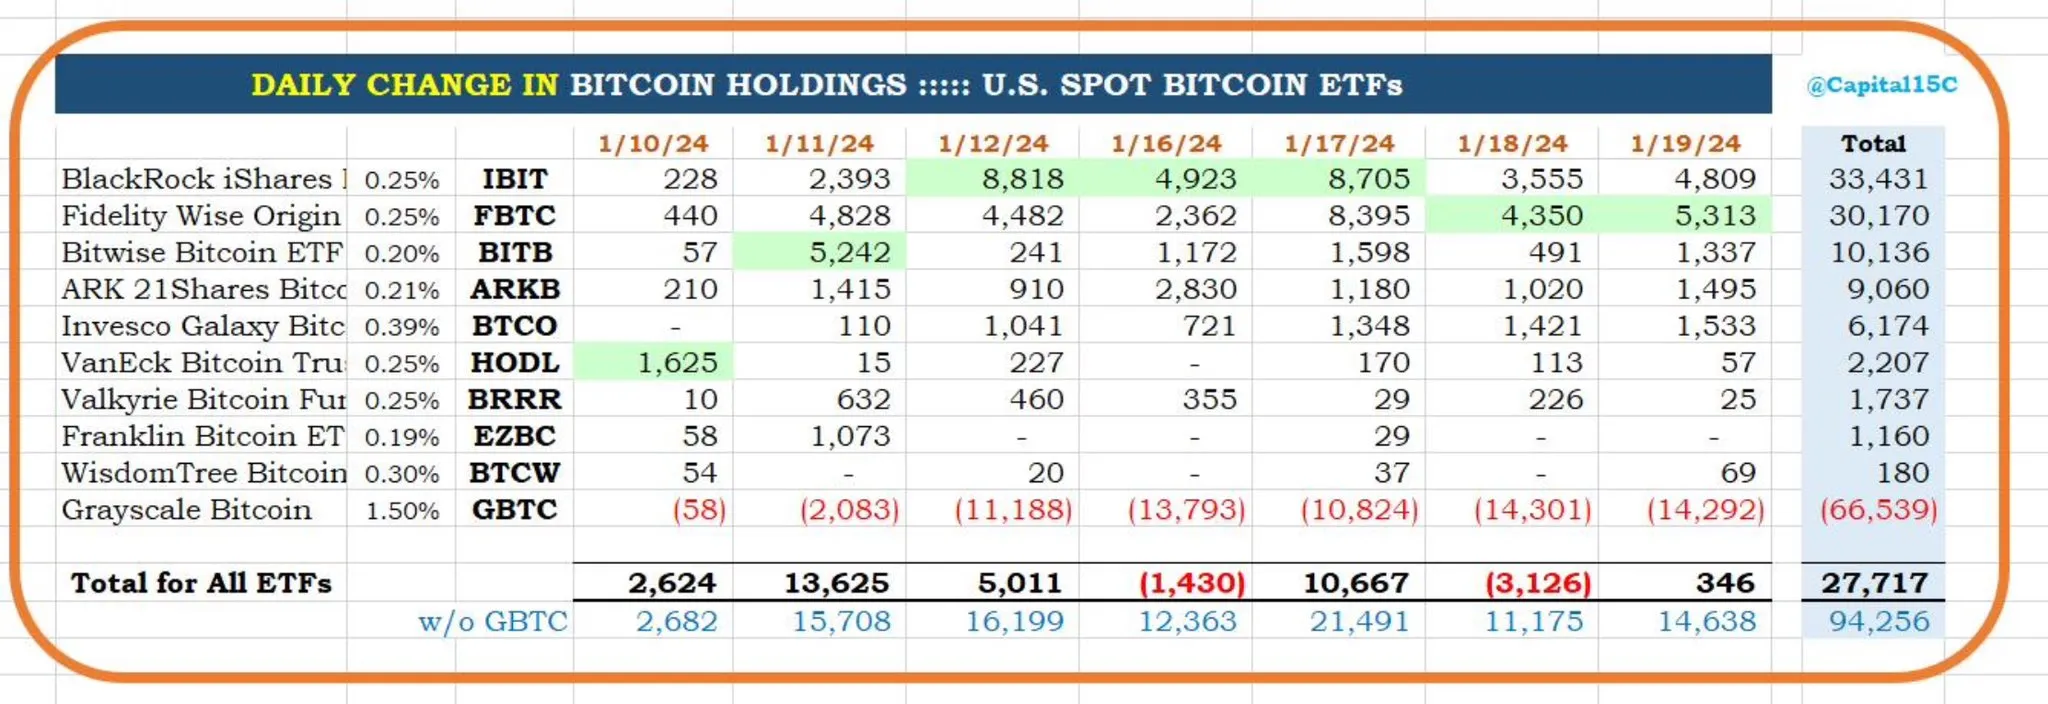 Spot ETF Bitcoin holdings. Source: X/@Capital15C
Secondly, the halving event in late April or early May, which will cut already limited new supplies of BTC by half, will limit downsides, said Weiss.
With 19.6 million BTC already circulating this will create a supply shock. Nevertheless, prices usually move six months after the halving so there may not be an immediate rally.
Read more: Who Owns the Most Bitcoin in 2024?
Crypto market cycles were the third reason Weiss cited for limited Bitcoin price downsides.
“The crypto four-year cycle itself, which has historically come with a major new price explosion precisely around this time.”
There are usually mid-cycle tops between major cycle peaks which appears to have occurred on Jan. 10 when BTC hit $48,500.
Moreover, a 30% correction has been predicted which could send Bitcoin prices back to around $34,000.
On Jan. 23, Glassnode analyst “Checkɱate” posted a chart showing previous cycle correction drawdowns so there could be more pain before the gains. BTC bull market correction drawdowns. Source: X/@_Checkmatey_
Crypto Market Outlook
Total market capitalization has fallen 3.3% on the day to $1.65 trillion at the time of writing. BTC had reclaimed the $40,000 price level but the short-term trend was still down.
Ethereum was changing hands for $2,337 after losing 4.1% on the day as it continues to correct.
The altcoins were a sea of red with larger losses for Solana, Avalanche, Chainlink, Polkadot, and Litecoin.
In adherence to the Trust Project guidelines, BeInCrypto is committed to unbiased, transparent reporting. This news article aims to provide accurate, timely information. However, readers are advised to verify facts independently and consult with a professional before making any decisions based on this content. Please note that our Terms and Conditions, Privacy Policy, and Disclaimers have been updated.