How AI-Based Indicators Actually Adapt to the Market (And Where They Don't)
"AI-powered" has become a label stuck on almost every trading tool released in the last two years. Some of that is marketing — a buzzword applied to a tool that behaves no differently from one built five years ago. But there is a real, specific thing that a genuinely adaptive indicator does differently from a classic fixed-parameter one, and it's worth understanding precisely what that is before you decide whether the extra cost, or the extra trust, is justified.
The problem with fixed-parameter indicators
A standard indicator — say, a SuperTrend with ATR multiplier 3 and period 10 — uses the same settings no matter what the market is doing. Those settings were chosen, consciously or by default, based on how the instrument behaved over some specific stretch of history. That works fine on the day it was tuned for. It works less well six months later, when volatility has doubled or halved, because the fixed multiplier was calibrated to a market condition that may no longer exist.
This is why so many traders end up with a drawer full of indicator settings for "trending market" and "choppy market," manually switching between them based on gut feel, or on noticing the indicator has started whipsawing badly. It works, sort of, for a trader who is paying close attention, but it's slow, it's inconsistent between traders, and it depends entirely on the trader noticing the regime has changed before switching — which is exactly the kind of judgment call that's easy to get wrong under pressure.
What "adaptive" actually means in practice
A genuinely adaptive indicator re-evaluates its own parameters against recent price behaviour instead of using one fixed number forever. In practice this usually means one, or a combination, of a few specific techniques:
- Rolling volatility re-calibration — the indicator measures recent ATR or standard deviation on a rolling basis and adjusts its multiplier or lookback window accordingly, so it tightens up in calm markets (fewer false signals, closer stops) and loosens in volatile ones (fewer whipsaws from noise that would otherwise trigger a stop-out).
- Clustering recent regimes — some tools group recent price behaviour into clusters (for example using a k-means style approach, or a simpler rule-based classifier) to label the current regime as trending, ranging, or volatile, then weight the signal logic differently for each label. A trending-regime classification might favour trend-following logic; a ranging-regime classification might favour mean-reversion logic instead.
- Confidence scoring — rather than a flat buy/sell signal with no further context, the indicator grades its own output, essentially saying "this setup matches historical conditions that worked well" versus "this is a lower-confidence signal, size down or skip." The scoring itself is usually derived from how similar setups performed historically, which is a legitimate statistical technique as long as it's validated properly (see the overfitting warning below).
- Multi-timeframe context blending — some adaptive tools pull a secondary, higher timeframe's trend or volatility reading into the decision on the primary timeframe, so a 5-minute signal is automatically weighted differently depending on what the daily or 4-hour chart is doing, without the trader manually checking both charts every time.
None of this predicts the future, and it's worth being precise about that distinction. It just means the indicator's internal assumptions stay closer to current conditions instead of drifting out of date the way a fixed-parameter tool does. The indicator is reacting faster and more systematically to what has already happened recently — it is not forecasting what hasn't happened yet.
Where adaptive tools genuinely help
The honest case for adaptive indicators is reduced maintenance and more consistent behaviour across changing conditions, not inherently higher win rates. A trader using a fixed SuperTrend has to periodically revisit and re-optimise the settings as the instrument's volatility character changes — NIFTY in a low-VIX year behaves differently from NIFTY in a high-VIX year, and a multiplier that worked well in one regime can produce a noticeably different risk/reward profile in the other. An adaptive version does that re-tuning continuously, in the background, so the tool keeps working without the trader having to babysit it or remember to revisit settings every quarter.
Confidence scoring is the other genuine benefit, when implemented honestly. Being told "this signal has historically had a weaker hit rate in conditions like these" is useful risk information, separate from whether the signal itself turns out to be right or wrong this particular time. It gives a trader a basis for sizing decisions — full size on high-confidence setups, reduced size or no trade on low-confidence ones — that a flat, ungraded signal simply doesn't provide.
Regime clustering also genuinely helps traders who struggle with the discipline of switching strategies manually. If a tool reliably classifies "this looks like a ranging day" and shifts its logic accordingly, that removes a decision point where human traders often freeze, second-guess themselves, or apply the wrong playbook out of habit.
Where the hype outruns the substance
A few things to watch out for when evaluating any tool marketed as AI-adaptive, because the label alone tells you very little about what's actually happening under the hood:
- "AI" doesn't mean it's forecasting price. Most adaptive trading tools are doing statistical regime detection or parameter re-calibration, not prediction in the sense of knowing where price is headed next. That's a legitimate and useful technique, but it's a fundamentally different claim than "the AI knows where price is going," and marketing copy sometimes blurs the two intentionally.
- Repainting is a separate issue from adaptiveness. An indicator can be fully adaptive — genuinely re-calibrating its parameters on rolling data — and still repaint its signals after the fact if it isn't built to lock values on bar close. The two properties are independent of each other. Always check repainting independently, even on a tool that markets its adaptiveness heavily; adaptiveness is not a substitute for non-repainting behaviour, and a vendor emphasising one doesn't mean they've addressed the other.
- Backtested confidence scores can be overfit. If a tool's "high confidence" rating was tuned on the same data used to grade it, the rating itself may not generalise well forward — a classic case of the model grading its own homework. Out-of-sample testing on a period the tool wasn't tuned against, with the scoring methodology held fixed, is the only real check against this.
- "Adaptive" is sometimes just a renamed moving average. Some tools marketed as AI-adaptive are doing nothing more sophisticated than a variable-length moving average that reacts to recent volatility — a decades-old technique with a new label. That's not necessarily bad, but it's worth knowing you're not paying an "AI premium" for a technique that's been publicly documented for a long time.
- More parameters adapting doesn't automatically mean better results. A tool that adapts five different internal parameters simultaneously is not automatically superior to one that adapts a single, well-chosen parameter. Complexity for its own sake can introduce more ways for the system to overfit to recent noise, not fewer.
One example of this category worth examining as a case study is the AI Adaptive Quant Toolkit, which combines volatility re-calibration, regime clustering and signal confidence grading into a single TradingView indicator — useful as a reference point for what the adaptive-indicator category looks like when implemented end to end, with each of the three techniques described above present in one tool rather than scattered across several.
A closer look: fixed vs adaptive on the same chart
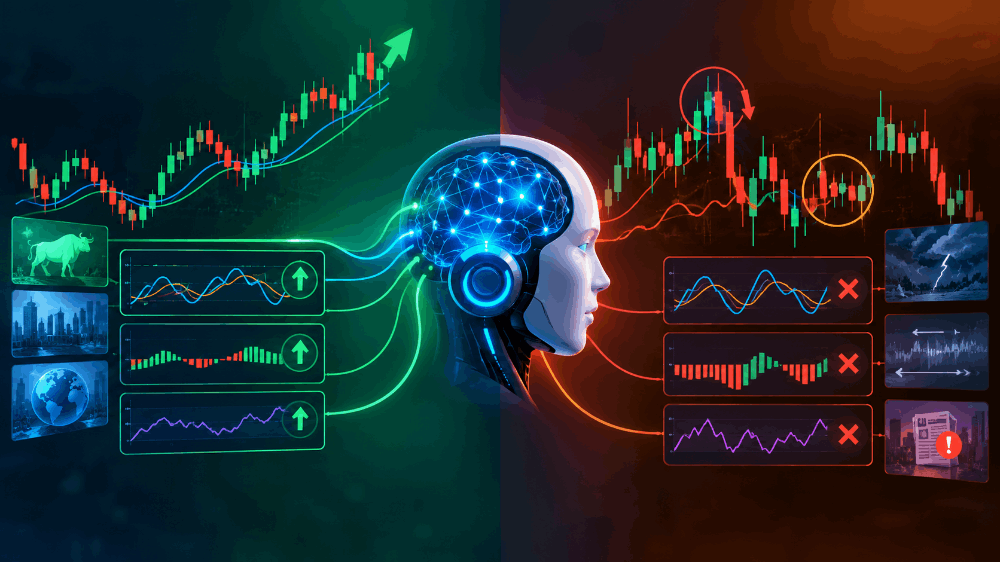
It helps to picture the difference concretely. Take a fixed-parameter trend indicator set with a 14-period lookback. During a calm, low-volatility stretch, a 14-period lookback might be appropriately responsive — tight enough to catch moves without excessive noise. During a sudden volatility spike, that same fixed 14-period window can start generating a cluster of false signals in quick succession, because the lookback window hasn't changed even though the character of the price action inside it has changed dramatically.
An adaptive version of the same underlying logic, by contrast, might automatically widen its effective lookback or loosen its sensitivity the moment recent volatility measures spike, specifically to avoid that false-signal cluster — then tighten back up once volatility measures settle again. The underlying signal logic (say, a trend-following crossover concept) can be identical between the two versions; the difference is entirely in how responsively the parameters feeding that logic move with the market, not in the core idea itself.
This is also why comparing an adaptive tool against a fixed one purely on a calm historical stretch can be misleading — the real test of adaptiveness is specifically how each one behaves across a transition from calm to volatile conditions and back, not how either performs within a single stable regime.
How to evaluate any adaptive indicator before trusting it
- Ask what specifically adapts — the stop distance, the signal threshold, the regime classification, the lookback window — rather than accepting "AI-powered" as a complete answer. A vendor who can name the exact mechanism is giving you something you can actually verify; one who can't is likely selling a label.
- Check for repainting independently, using a bar-replay test on the charting platform, regardless of how the adaptiveness itself is marketed.
- Paper trade it through at least one full volatility cycle (a calm stretch and a choppy stretch) before trusting the confidence grading with real capital, since a single-regime test can't show you whether the adaptation actually helps across a transition.
- Ask whether the confidence scoring was validated out-of-sample, on data the scoring model wasn't tuned against, and treat a refusal or vague answer to that question as a yellow flag.
- Compare the tool's behaviour against a simple fixed-parameter version of a similar concept on the same chart, across the same stretch of history, to get a concrete sense of what the adaptiveness is actually buying you in practice rather than in marketing language.
Common misconceptions worth clearing up
"Adaptive means it learns from my specific trades." Almost never true for a retail charting indicator. Most adaptive indicators adapt to recent price/volatility data generally, not to an individual trader's personal win/loss history. A tool that claims to personalise itself to your specific trading results is making a much bigger and much harder-to-verify claim than standard regime adaptation.
"A higher confidence score guarantees a better outcome this trade." A confidence score is a historical tendency, not a guarantee for any single occurrence. Even a well-validated 70% historical hit rate for high-confidence signals still means three in ten fail — sizing and stop discipline still matter on every single trade, confidence score or not.
"If it's adaptive, it doesn't need a stop-loss." Adaptiveness changes how an indicator forms its signals; it does not remove the need for risk management on the position those signals lead to. Every trade still needs a defined exit plan regardless of how sophisticated the entry logic behind it is.
Why vendors reach for the "AI" label so often
It's worth understanding the commercial incentive behind the labelling, since it explains a lot about why the term shows up on tools that may not deserve it. "AI-powered" tests well in marketing copy — it signals sophistication and justifies a higher price point, even when the underlying technique is a well-established statistical method that has existed in trading software for a long time under less fashionable names like "adaptive moving average" or "volatility-adjusted indicator."
This doesn't mean every tool using the label is misrepresenting itself. Some genuinely do run the kind of clustering, scoring, or rolling re-calibration described earlier, and the label is a reasonably fair shorthand for that. The practical problem is that from the outside, as a buyer, you can't tell which category a given tool falls into from the label alone — "AI-powered" could mean a carefully validated regime classifier, or it could mean a simple moving average with a new name and a markup. The only way to tell the difference is to ask the specific questions in the evaluation checklist above and see whether the vendor can answer them concretely.
How adaptive logic specifically changes risk management, not just entries
Most discussion of adaptive indicators focuses on entry signals — when the tool says buy or sell. But the more practical, day-to-day impact of genuine adaptiveness often shows up in exit and stop-management logic, which is where a lot of a trading system's real performance is actually decided.
A fixed-ATR-multiple stop-loss, for example, uses the same multiple of average true range regardless of whether that ATR reading was calculated during a calm week or a wild one. An adaptive stop that recalculates its effective distance using a shorter, more reactive volatility window can tighten meaningfully faster after a volatility spike begins to fade, which in practice means it gives back less open profit waiting for a stop that was sized for a market condition that no longer exists. The reverse is also true — during an unexpected volatility expansion, an adaptive stop that widens in response can avoid getting stopped out by noise that a fixed-distance stop would have been hit by, at the cost of carrying slightly more open risk during that specific window.
Neither behaviour is universally "better" — a trader who prioritises capital preservation over giving a trade room to work might prefer the faster-tightening version even if it occasionally exits a winning trade early, while a trader running a trend-following system that depends on letting winners run might prefer the wider adaptive stop even though it means occasionally giving back more profit on a reversal. The point is that adaptive risk management is a design choice with real trade-offs, not an unambiguous upgrade, and it's worth understanding which trade-off a specific tool has made before relying on it.
A simple mental model for deciding whether you need an adaptive tool at all
Not every trader needs adaptive logic, and it's worth being honest about that rather than assuming more sophistication is automatically better for your specific situation. A few questions that help clarify this:
- Do you trade the same instrument across very different volatility regimes over the course of a year? A trader focused narrowly on one short, consistent intraday window on one instrument may see less benefit from adaptive re-calibration than a trader holding positions across weeks or months spanning calm and volatile stretches.
- Are you currently manually adjusting your own settings when conditions change, and finding that process reliable? If your manual process already works and you trust your own judgment on when to switch, an adaptive tool is automating something you're already doing reasonably well — useful for convenience, but not solving an acute problem.
- Have you actually been burned by a fixed-parameter tool whipsawing after a volatility regime shift? If this has happened to you specifically, that's a concrete, personal case for testing an adaptive alternative, rather than adopting one on the strength of marketing copy alone.
The honest answer for many retail traders, particularly those trading one or two familiar instruments with a consistent intraday routine, is that disciplined manual review of settings every month or quarter achieves most of the same benefit as an automated adaptive system, just with slightly more effort. Adaptive tools earn their keep most clearly for traders juggling multiple instruments or timeframes where manual review becomes impractical to keep up with.
Frequently asked questions
Do adaptive indicators cost more than fixed-parameter ones?
Often yes, since the additional engineering and backtesting validation behind a genuinely adaptive tool typically costs more to build than a fixed-parameter indicator, and that cost tends to be reflected in price. This is exactly why it's worth confirming the tool is doing real adaptive work rather than paying a premium for a relabelled static indicator.
Can I build a simple adaptive indicator myself in Pine Script?
Yes — rolling ATR-based re-calibration of a stop distance or signal threshold is a well-documented, learnable technique and doesn't require machine learning in the deep-learning sense. Regime clustering and historically validated confidence scoring are considerably more involved to build and validate correctly, which is usually where the case for buying a pre-built tool strengthens.
Will an adaptive indicator stop working if the market enters a regime it has never seen before?
Any tool calibrated on historical data, adaptive or not, carries some risk of behaving unpredictably in genuinely unprecedented conditions. Adaptive logic reduces — it does not eliminate — this risk, because it is still reacting to patterns drawn from history, applied to a present that may occasionally diverge sharply from anything in that history.
Is a higher number of adapting parameters always more sophisticated and better?
No. As noted earlier, more simultaneously adapting parameters increases the surface area for overfitting to recent noise rather than capturing a genuine, persistent pattern. A tool that adapts one or two carefully chosen parameters with solid out-of-sample validation can outperform one that adapts many parameters without that same rigor.
The bottom line
Adaptive indicators are a real improvement over static ones for traders who don't want to manually re-tune settings every few months, or who struggle with the discipline of switching playbooks when conditions change. They are not a shortcut past basic risk management, position sizing, or testing — those still matter exactly as much as they did with a plain SuperTrend, and no amount of adaptiveness in the signal generation changes the arithmetic of how much you risk per trade.
Whichever path you choose, the questions to keep asking are the same ones that run through this whole guide: what specifically adapts, has it been checked for repainting independently of the adaptiveness claim, and has the confidence or performance grading been validated on data it wasn't tuned against. A tool that answers all three clearly has earned a fair test. One that answers with marketing language instead of mechanism deserves more scepticism, regardless of how polished the chart overlay looks.
This article is for educational purposes only and is not investment advice. Trading involves risk, and past performance of any indicator does not guarantee future results.