The four year cycle is dead.....again

Good morning/evening
If you have been involved in crypto for any length of time, you have probably seen countless charts claiming to predict where Bitcoin is heading next. During the last cycle I saw Bitcoin supposedly following gold, the M2 money supply, global liquidity, the dollar index and probably half a dozen other indicators that I have forgotten about. The thing with this is that you can bend a chart around to fit whatever narrative you want, also Bitcoin may well follow this that or the other, untill it does not!
Every time Bitcoin went up, somebody would find a chart showing why they predicted it. Every time Bitcoin went down, a different chart would appear explaining why it was obvious all along. It can be difficult to separate genuine indicators from people trying to fit a narrative to price action after the fact.
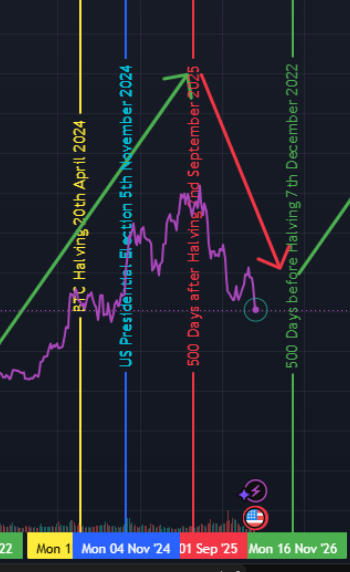
Personally, I still find myself coming back to one thing and that is the four year cycle, the theory is relatively simple, approximately every four years Bitcoin undergoes a halving event, reducing the amount of new Bitcoin entering circulation and this has created a pattern that looks something like this:
- Bitcoin bottoms after a bear market.
- Accumulation takes place.
- The halving arrives.
- A bull market follows.
- Euphoria takes over.
- A major correction eventually arrives.
It is not perfect and nobody knows if it will continue forever, but so far it has been surprisingly consistent, the thing is IMO if whales and long time holders still believe in the four year cycle and sell when they believe it is that time, then perhaps it becomes a self fullfilling prophecy.
I have heard many people say that last cycle was different because institutions are involved, ETFs exist and governments are paying attention. It was a left translated cycle so on and so forth, but on my chart the peak was pretty much where it should have been......I should have trusted my plan, not that it was that bad, but I did miss out on some gains because instead I was starting to listen to all the noise.
I was sent an interesting article, I have read it six times now and I am still swaying towards the four year cycle, yes the institutions have taken over a large percentage of the fixed supply of Bitcoin and yes they trade differently to retail, the volatility might well be less but surely just the fact that the asset is so large means it takes more to move the needle so to speak, I am also not expecting such huge gains but even just doubling your investment isn't such a bad thing IMO. If I am honest the answer would be that I do not know what Bitcoin will follow or do this cycle, but then nobody does, I could have followed a $90 per month top and bottom indicator last season from the patreon I am in, but I did not which is good because it did not work, neither did many free indicators available.
The M2 Money Supply
One of the most popular charts last cycle was Bitcoin versus global M2 money supply, in simple terms, M2 measures the amount of money circulating within an economy. When governments and central banks increase liquidity, more money becomes available for investment. The theory is straightforward, if there is more money available, some of it eventually finds its way into assets such as stocks, property and Bitcoin.
What made this chart so popular was that many analysts claimed Bitcoin was following M2 with a delay of several months for periods of time the relationship looked almost uncanny. The problem is that once enough people start watching a chart, it becomes easy to see patterns that may not actually exist.
Bitcoin And Gold
Another comparison that gained a lot of attention was Bitcoin versus gold, for years Bitcoiners have referred to Bitcoin as digital gold, but last cycle was one of the first times where many investors seriously started treating it that way. When gold broke to new all time highs before Bitcoin, many analysts suggested Bitcoin would eventually follow, first it was a month behind them two then three and so on but the difference is that gold has thousands of years of history behind it.
The business cycle
Another indicator that has become increasingly popular among investors is the business cycle.
In simple terms, economies tend to move through periods of expansion and contraction. During good times, businesses invest, consumers spend money and employment is generally strong. Eventually growth begins to slow, companies become more cautious and the economy can enter a period of weakness before the cycle starts again.
Many analysts believe Bitcoin follows these broader economic trends because it is still viewed as a risk asset. When economic conditions improve and investors become more confident, money tends to flow into stocks, technology companies and increasingly Bitcoin. When recession fears grow and investors become defensive, risk assets often struggle.
This is why indicators such as manufacturing data, employment figures and central bank interest rate decisions received so much attention. They can provide clues as to where we are in the business cycle and whether liquidity is likely to increase or decrease. The theory is that Bitcoin performs best when the economy is moving from a period of weakness into renewed growth, as investors become willing to take on more risk, but of course, just like every other indicator, it is far from perfect. Economists have spent decades trying to predict business cycles with mixed success, so expecting them to perfectly predict Bitcoin may be asking a bit much.
The Dollar Index
The relationship between Bitcoin and the US Dollar Index is one of the oldest macro indicators around and the basic idea is that a strong dollar puts pressure on risk assets, while a weaker dollar creates more favourable conditions and again, there have been periods where this relationship looked incredibly accurate and periods where it completely fell apart.
That seems to be the problem with almost every indicator in crypto. They work until they don't.
Could The Four Year Cycle Finally Break?
This is the question many investors are asking.
The launch of spot Bitcoin ETFs has brought a huge amount of institutional capital into the market. Companies are now holding Bitcoin on their balance sheets and governments are discussing strategic reserves, but despite all of these changes, human behaviour remains remarkably consistent. Greed still exists, fear still exists and people will still become convinced prices can only go up and will still panic when prices start falling.
Perhaps the cycle is not really about the halving at all. Perhaps it is about human psychology repeatedly playing out in a market with a fixed supply asset at its centre. If economic expansions and contractions happen to line up with Bitcoin's halving schedule, perhaps the two forces are reinforcing each other rather than competing explanations.
Final Thoughts
I enjoy looking at the macro charts and I find many of them interesting, some may even have genuine predictive value, but if I am honest, every cycle there seems to be a new chart that supposedly explains everything while Bitcoin quietly continues to do what it has done for most of its existence, move in roughly four year waves around the halving cycle.
Will it continue forever? Probably not. Will it continue this cycle? I honestly have no idea but I have already bought some, have buy orders in for more, some at cheeky levels it may not go down too, I also have some stablecoins ready if we do go down further and a daily DCA, so trying to cover all eventualities. I have followed my chart forward to where I expect the bottom and then the top to be, could be wrong, but I will know in a couple of years lol.
What do you think? Are the liquidity charts finally replacing the four year cycle, or are we all overcomplicating something that has worked surprisingly well for over a decade?