How to Validate TradingView Indicators Before Using Them in Live Trading
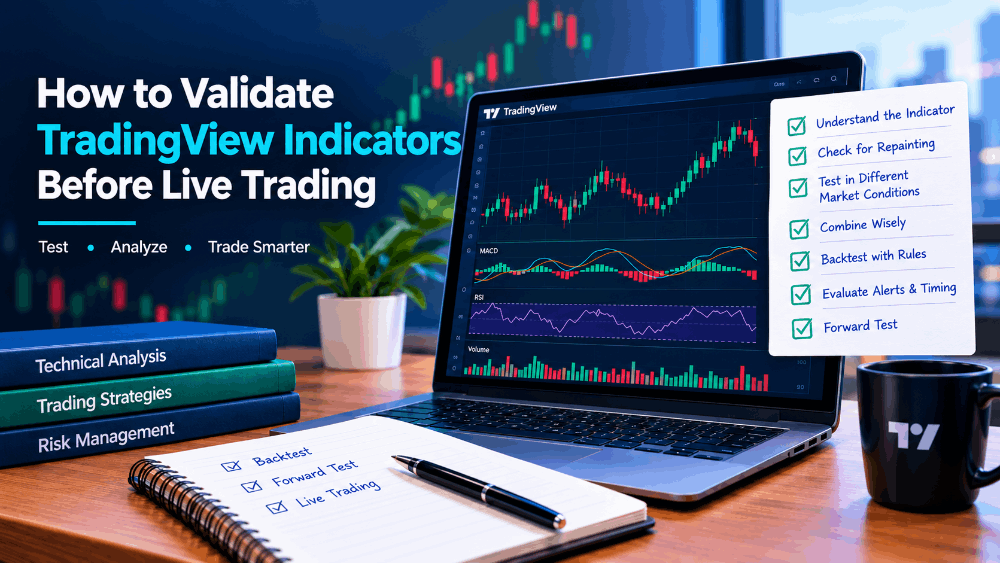
TradingView offers a wide range of tools for identifying trends, measuring momentum, spotting potential reversals, and analyzing market structure. However, choosing the right indicator requires more than looking at buy and sell signals. Traders must understand how the indicator behaves, whether its signals change after appearing, and how its performance holds up across different market conditions.
In this guide, we will explore seven practical ways to validate TradingView indicators before using them in live trading.
1. Understand What the Indicator Actually Measures
Before adding an indicator to your chart, understand the information it is designed to provide. Different indicators analyze different aspects of market behavior, and confusing their purposes can lead to poor decisions.
For example, trend indicators help identify the broader market direction, while momentum indicators measure the strength of price movements. Volatility indicators help traders understand changing price ranges, and market structure tools highlight areas where price may react.
What to check before using an indicator:
- Primary purpose: Determine whether the indicator measures trend, momentum, volatility, or market structure.
- Signal conditions: Understand what must happen before a buy or sell signal appears.
- Limitations: Identify the market conditions in which the indicator may produce misleading signals.
- Timeframe suitability: Check whether the tool is appropriate for scalping, intraday trading, or swing trading.
A clear understanding of an indicator helps traders avoid treating every signal as an independent trading opportunity.
2. Check Whether the Indicator Repaints
Repainting is an important issue to investigate when evaluating TradingView indicators. Some indicators change, remove, or reposition historical signals as new price information becomes available. This can make past performance look better than what a trader could have observed in real time.
Not every indicator that updates during an active candle is necessarily repainting incorrectly. Some calculations naturally change before a candle closes. The important question is whether confirmed historical signals remain consistent after the relevant candle has closed.
How to investigate repainting:
- Observe signals while the candle is forming and after it closes.
- Record the location and timing of confirmed signals.
- Reload the chart and check whether historical signals have changed.
- Use Bar Replay to observe how the indicator behaves as new candles appear.
- Read the indicator's documentation to understand confirmation delays and calculation rules.
For additional guidance, explore Quantzee's guide to non-repainting TradingView indicators, along with its indicator documentation and testing resources.
A stable historical signal record makes performance evaluation more meaningful, although it does not guarantee that an indicator will be profitable.
3. Test the Indicator Across Different Market Conditions
An indicator may perform well during a strong trend but struggle when the market moves sideways. Similarly, a tool designed to identify reversals may produce repeated false signals during a powerful directional move.
Testing only one favorable market period can create an unrealistic impression of performance.
Include different market environments in your evaluation:
- Trending markets: Check whether signals follow sustained directional movements.
- Range-bound markets: Observe how frequently the indicator generates false breakouts.
- High-volatility sessions: Evaluate whether signals become less reliable during sharp price movements.
- Low-volatility periods: Check whether the indicator produces enough meaningful opportunities.
- Reversal phases: Determine whether signals appear early, late, or after a significant move has already occurred.
Where possible, test different instruments and historical periods. A strategy that works on one stock or currency pair may behave differently on an index or cryptocurrency.
The objective is not to find an indicator that works perfectly everywhere. Instead, identify the conditions in which its signals are most useful and understand when caution is necessary.
4. Combine Indicators Without Creating Chart Clutter
Using several indicators together can improve analysis when each tool contributes different information. However, adding more indicators does not automatically improve trading decisions.
For example, combining two trend indicators that rely on similar moving-average calculations may provide little additional confirmation. In contrast, combining a trend indicator with a momentum tool may help traders evaluate both direction and strength.
A practical combination might include:
- Trend indicator: Establish the broader market direction.
- Momentum indicator: Assess whether buying or selling pressure supports the move.
- Market structure tool: Identify relevant support, resistance, or potential breakout areas.
- Risk management rules: Define entry conditions, stop-loss placement, and exit criteria.
Start with one or two complementary tools and measure whether adding another indicator improves decision quality.
You can also explore Quantzee's trading indicator guides to learn how different indicators work and how they can be incorporated into a more structured analysis process.
5. Backtest Signals Using Consistent Rules
Backtesting allows traders to evaluate a trading approach against historical market data. It helps determine whether a set of rules would have produced acceptable results in previous market conditions.
However, meaningful backtesting requires consistent rules. Changing entry criteria whenever a trade loses can make the final results unreliable.
Define these rules before testing:
- The exact condition required to enter a trade.
- The stop-loss and profit-taking method.
- The position-sizing approach.
- The timeframe and instrument being tested.
- The conditions under which a trade should be skipped.
Track several performance measures rather than focusing exclusively on the winning percentage.
Important metrics include:
- Win rate: The percentage of trades that close profitably.
- Profit factor: Gross profits divided by gross losses.
- Maximum drawdown: The largest decline from a previous equity peak.
- Average win versus average loss: The relationship between typical profitable and losing trades.
- Trade count: The number of observations supporting the results.
For a deeper explanation of performance evaluation, read Quantzee's guide to profit factor.
Remember that historical performance does not guarantee future results. Trading costs, slippage, and changing market conditions can significantly affect live outcomes.
6. Evaluate Alerts and Signal Timing
An indicator may look useful on a chart but still be inconvenient for a trader's daily workflow. Signal timing, alert reliability, and notification delays can influence whether a setup is practical to execute.
This is particularly important for intraday traders who cannot monitor every chart continuously.
Evaluate the alert system by checking:
- Whether alerts trigger under the intended conditions.
- Whether alerts are generated on candle close or during candle formation.
- Whether repeated notifications occur for the same setup.
- Whether the alert message contains enough information to identify the instrument and signal.
- Whether mobile notifications or webhook integrations operate as expected.
TradingView alerts should match the rules used in backtesting. If the backtest assumes a confirmed candle but the live alert triggers earlier, the two processes are not equivalent.
Test alerts in a simulated or paper-trading environment before relying on them for live execution.
7. Forward-Test Before Risking Real Capital
Historical testing is only one part of indicator validation. Forward testing allows traders to observe how an indicator behaves on new market data without immediately risking real money.
During this stage, follow the same rules used in the backtest. Record each signal, the planned entry, the stop-loss, the exit, and the eventual result.
Maintain a simple trading journal containing:
- Date and time of the signal.
- Instrument and timeframe.
- Market condition at the time of entry.
- Entry and exit prices.
- Planned risk and actual outcome.
- Any differences between expected and observed behavior.
Review the results after collecting a meaningful sample of trades. Look for recurring problems, such as late entries, frequent false signals, or poor performance during sideways markets.
Avoid changing the rules after every losing trade. Instead, look for repeatable patterns supported by your recorded data.
Once the indicator has demonstrated acceptable behavior, consider beginning with small position sizes and gradually reassessing its performance. No amount of testing removes trading risk entirely.
Frequently Asked Questions (FAQs)
1. How do I know whether a TradingView indicator is reliable?
Evaluate its calculation logic, signal stability, performance across market conditions, and results under consistent backtesting rules. Forward-test it before using real capital.
2. What does a non-repainting indicator mean?
A non-repainting indicator generally preserves its confirmed historical signals rather than moving or removing them after confirmation. Always check its documentation to understand how and when signals become final.
3. Is backtesting enough to prove an indicator is profitable?
No. Backtesting measures how a strategy would have behaved under historical conditions. Forward testing, realistic transaction costs, slippage, and changing market environments must also be considered.
4. How many indicators should I use on a TradingView chart?
There is no universal ideal number. Start with one or two complementary indicators and add more only when they provide useful information that improves your decision-making process.
5. Can AI-powered trading indicators predict market movements accurately?
AI-powered indicators can analyze patterns and adapt certain calculations, but they cannot predict every market movement reliably. Their outputs should be evaluated through independent testing and combined with risk management.
6. Should beginners use paid TradingView indicators?
Beginners can start with free tools to learn technical analysis. A paid indicator may be worth considering when its features, documentation, usability, and testing process justify the cost. Price alone does not establish effectiveness.
Conclusion
Validating a TradingView indicator requires more than identifying attractive signals on historical charts. Traders need to understand its purpose, investigate repainting behavior, test it across different market conditions, and evaluate its performance using consistent rules.
Combining complementary tools, checking alert timing, maintaining a trading journal, and conducting forward tests can help build a more disciplined trading process. The goal is not to find an indicator that never produces a losing trade, but to understand its strengths, limitations, and suitability for a particular strategy.
Explore Quantzee for TradingView indicator tools, technical analysis guides, and resources that can help you build a more structured approach to evaluating trading signals.
Disclaimer: This article is for educational purposes only and does not constitute financial or investment advice. Trading involves risk, and past performance does not guarantee future results.