achine Learning(Part 2)Statistics for M

Part 2: Observations and Variables
Table of Content
- What is Data
- Observations
- Types of Variables
1- What is Data
The word “data” appears in many contexts and frequently is used in ordinary conversation. Although the word carries something of an aura of scientific mystique, its meaning is quite simple and mundane. It is Latin for “those that are given” (the singular form is “datum”) [4]. • Data are collected in many aspects of everyday life
2- Observations
In statistics, an observation often means any sort of numerical recording of information, whether it is a physical measurement such as height or weight; a classification such as heads or tails, or an answer to a question such as yes or no [4].in statistics, an observation often means any sort of numerical recording of information, whether it is a physical measurement such as height or weight; a classification such as heads or tails, or an answer to a question such as yes or no
3- Variables
A characteristic that varies with an individual or an object is called a variable. For example, age is a variable as it varies from person to person. A variable can assume a number of values. The given set of all possible values from which the variable takes on a value is called a domain. If for a given problem, the domain of a variable contains only one value, then the variable is referred to as a constant [4].
4- Types of Variables
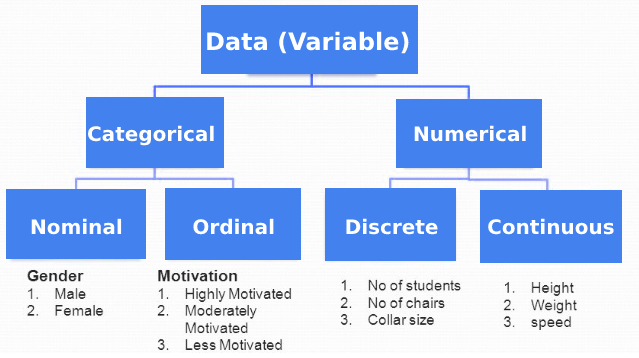
4.1- Quantitative and Qualitative Variable
Variables may be classified into quantitative and qualitative according to the form of the characteristic of interest. A variable is called a quantitative variable when a characteristic can be expressed numerically such as age, or weight, On the other hand, if the characteristic is non-numerical such as education, sex, eye colour, quality, intelligence, poverty, satisfaction, etc. the variable is referred to as a qualitative variable. A qualitative characteristic is also called an attribute.A qualitative characteristic is also called an attribute. An individual or an object with such a characteristic can be counted or enumerated after having been assigned to one of the several mutually exclusive classes or categories.
4.2- DISCRETE AND CONTINUOUS VARIABLES
A quantitative variable may be classified as discrete or continuous. discrete data can take on a countable number of values, such as the number of students in a class. A discrete variable is one that can take only a discrete set of integers or whole numbers, which is the values, are taken by jumps or breaks.1, 5, 8, 11, 35 . The specific set of values. A discrete variable represents count data such as the number of persons in a family, the number of rooms in a house, the number of deaths in an accident, the income of an individual, etc.[4]
A variable is called a continuous variable. Continuous data can take on any value within a certain range. It can take on any value-fractional or integral — within a given interval, i.e. its domain is an interval with all possible values without gaps. A continuous variable represents measurement data such as the age of a person, the height of a plant, the weight of a commodity, and the temperature at a [4] place, etc.1, 2, 3,4, 5,6, 7 … Take a number of values in a given range.
4.3- Numerical Variable
The value that contains an integer.
4.4- Measurement Scales
By measurement, we usually mean the assigning of numbers to observations or objects and scaling is a process of measuring. The four scales of measurement are briefly mentioned below [4]
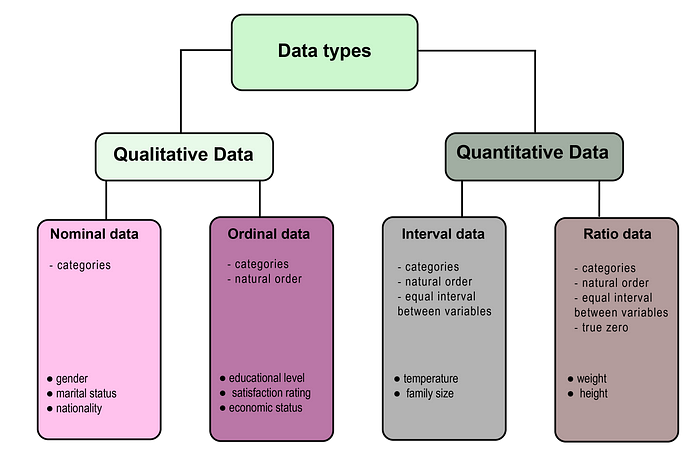
4.4.1- Nominal Scale
The classification or grouping of the observations into mutually exclusive qualitative categories or classes is said to constitute a nominal scale. For example, students are classified as male and female. Numbers 1 and 2 may also be used to identify these two categories [4]. The numbers when they are used only to identify the categories of the given scale carry no numerical significance and there is no particular order for the grouping. Nominal data refers to categorical data where each value represents a separate category with no intrinsic order or ranking, such as gender, nationality, or religion [3].
4.4.2- Ordinal or Ranking Scale
It includes the characteristic of a nominal scale and in addition has the property of ordering or ranking of measurements. For example, the performance of students (or players) is rated as excellent, good fair or poor, etc. Numbers 1, 2, 3, 4, etc. are also used to indicate ranks. The only relation that holds between any pair of categories is that of “greater than” (or more preferred) [4]. Ordinal data represents categories with an inherent ranking or order, such as educational level or income bracket [8].
4.4.3- Interval Scale
A measurement scale possessing a constant interval size (distance) but not a true zero point, is called an interval scale. Temperature measured on either the Celsius or the Fahrenheit scale is an outstanding example of an interval scale because the same difference exists between 20o C (68o F) and 30o C (86o F) as between 5o C (41o F) and 15o C (59o F). It cannot be said that a temperature of 40 degrees is twice as hot as a temperature of 20 degrees, i.e. the ratio 40/20 has no meaning. The arithmetic operation of addition, subtraction, etc. is meaningful [4]. Interval data represent numerical data with equal intervals between values (values cannot be expressed or presented in the form of a decimal), but without a true zero point, such as temperature measured in Celsius or Fahrenheit [3].
4.4.4- Ratio Scale
It is a special kind of interval scale where the sale of measurement has a true zero point as its origin. The ratio scale is used to measure weight, volume, distance, money, etc. The, key to differentiating interval and ratio scale is that the zero point is meaningful for the ratio scale [4].And finally, Ratio data represent numerical data with equal intervals between values and a true zero point, such as weight or height [3].
4.6- Categorical Variable
Contains categories instead of numbers, such as human body shapes such as; skinny, fat, or muscular.
4.7- Dependent Variable
The two variables, when one changes if the other will change will be dependent variables.
4.8- Independent Variable
If others won’t change, independent.
Please Follow coursesteach to see latest updates on this story
Part1:Statistics for Machine Learning (Part 1)
If you want to learn more about these topics: Python, Machine Learning Data Science, Statistic For Machine learning, Linear Algbra for Machine learning Computer Vision,
Then Login and Enroll in Coursesteach to get fantastic content in the data field.
References
1-Statistics For Data Science — Part 1
2- Statistics for Machine Learning A-Z
3-Python Statistical Analysis: Measures of central tendency and dispersion
4-Statistics and Probability(Virtual University of Pakistan)