Why Crypto Traders Miss Important Market Moves Even When They're Watching the Charts

You can watch a crypto chart all day and still miss the move that matters.
It sounds contradictory, but it happens because price is only one part of the market. Traders often focus on candles, support, resistance, and indicators while important information is developing somewhere else.
A whale may be moving funds. Liquidity may be changing. Open interest may be building. A major announcement may be about to shift sentiment.
By the time all of that becomes obvious on the chart, the market may have already reacted.
The Chart Shows What Happened
Charts are essential for understanding price action, but they don't always explain the reason behind it.
Suppose BTC suddenly moves 3% higher.
The chart shows the breakout. But to understand the move, you may need to look at:
- Trading volume
- Liquidity
- Open interest
- Funding rates
- Liquidations
- Whale activity
- News and market events
Without that additional information, a trader may see the movement without understanding its context.
Information Can Move Before Price
Markets don't always wait for a candlestick pattern to develop.
A major event can trigger changes in positioning, liquidity, and trading activity before the broader market reacts.
For example:
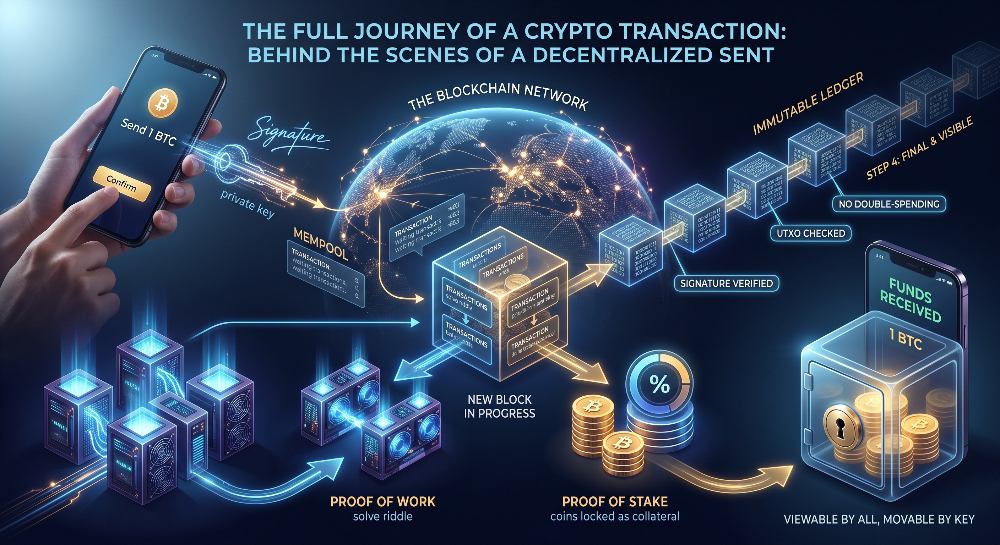
Market event → Positioning changes → Liquidity shifts → Trading activity increases → Price reacts
A trader watching only the final stage may feel like the move came out of nowhere.
It usually didn't.
The information simply wasn't being monitored.
More Data Isn't Always the Answer
The obvious solution might be to open more dashboards.
One for charts.
One for derivatives.
One for on-chain data.
One for whale movements.
One for news.
Soon, you're watching several screens but still trying to figure out what actually matters.
The problem isn't necessarily a lack of data.
It's connecting the right data together.
Liquidity Can Change the Picture
Liquidity is one of the market factors that can easily be missed when focusing only on price.
Large liquidity zones can influence how price behaves around certain levels. But liquidity can also move or disappear quickly.
This means traders need to pay attention not only to where liquidity is, but also to how it is changing.
A price level that looks important on a chart may have a very different setup if the underlying liquidity has shifted.
Derivatives Tell Another Story
Futures and perpetual markets provide additional clues about trader positioning.
Metrics such as open interest, funding rates, and liquidations can help reveal whether leverage is building or being removed.
For example, a strong price move combined with rapidly rising open interest tells a different story from a price move happening while open interest falls.
Neither scenario guarantees what happens next.
But the additional context can help traders avoid making decisions based on price alone.
Whale Activity Can Be Useful, but Context Matters
Large wallet movements often attract attention.
A significant transfer to an exchange, unusual accumulation, or movement between major wallets can be worth investigating.
But a whale transaction isn't automatically bullish or bearish.
The important question is:
What does the activity mean alongside the rest of the market?
When whale movements align with changes in liquidity, volume, derivatives, or market events, they become more interesting.
AI Can Help Filter the Noise
This is where AI trading intelligence can become useful.
Crypto markets generate enormous amounts of information every minute. Manually monitoring everything isn't realistic.
AI can help monitor multiple market layers and surface developments that deserve attention.
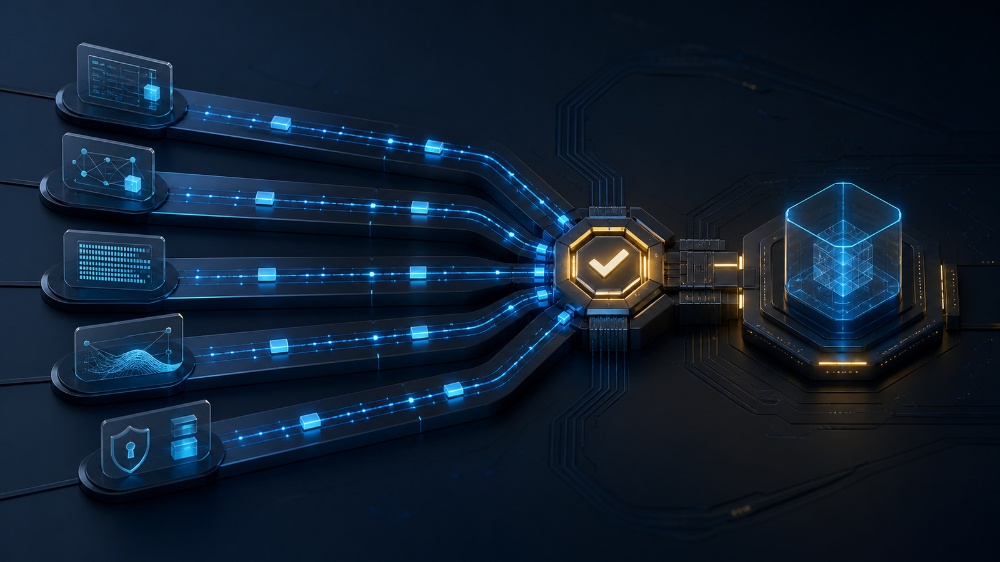
Instead of receiving dozens of unrelated alerts, traders can benefit from information that connects:
Price + liquidity + derivatives + whale activity + events
The goal isn't to let AI predict every trade.
It's to make important information easier to find and understand.
Where i5.xyz Fits In
This is the problem i5.xyz is built around.
i5 is being developed as a crypto trading intelligence platform focused on bringing different layers of market information together, including market activity, liquidity, derivatives, and events.
Rather than simply showing traders another chart, the idea is to provide more market context around what's happening.
That can help turn:
"BTC just moved."
into:
"BTC moved, and here's what was happening around that move."
That distinction matters when markets are moving quickly.
A Better Way to Watch the Market
You don't need to monitor every possible metric.
A simple process can be enough:
1. Watch price: Understand the current structure.
2. Check activity: Look for unusual volume or volatility.
3. Monitor positioning: Review derivatives and liquidity.
4. Look for catalysts: Check news and major events.
5. Connect the information: Ask whether the different signals support the same story.
This creates a more complete view without turning trading into endless data collection.
Final Thoughts
Crypto traders don't always miss important moves because they weren't watching.
Sometimes, they were watching only the chart.
Price is the visible part of the market, but liquidity, derivatives, whale activity, news, and other developments can provide the context behind that movement.
The goal isn't to predict every move perfectly.
It's to understand what is changing before the move becomes obvious.
That's where crypto market intelligence can make the difference.
Don't just watch the market. Understand what's happening around it.
i5 Testnet Coming Soon
The i5 testnet is coming soon. If you want to follow the development and get access updates:
Join the i5 Testnet Whitelist:
https://shorturl.at/khXrD
Join i5 on Telegram for more updates:
https://t.me/I5Labs