Business cycles and economic indicators
Business cycles
Modern business cycles have less volatile fluctuations than the old ones. Several economic policies played an important role to dampen the severity of the cycles. Deposit insurance made bank runs less likely. Unemployment compensation made it possible to support aggregate demand during economic hardship periods because it made it possible to sustain consumption during these times. One of the reasons for the preindustrial business cycles was over- and undershoot of inventory accumulation which was reduced due to the advance of information technology. Information technology improved supply chain and inventory management.
The change of postindustrial job economy also affected the nature of business cycles. More jobs are provided by service-producing sectors rather than by manufacturing sectors. That goods-producing sectors tend to express more cyclicality than services sectors, healthcare, and education among others, impacted the nature of business cycles. An increase in the proportion of the jobs in less cyclical sectors helped dampen economic weakness and contributed to more moderate business cycles. This is not the case with the economies where goods-producing jobs dominate.
Indicators
Multiple indicators were developed by NBER to better understand and track business cycles. There are three types of indicators. Leading, coincident, and lagging indicators predict, date, and follow turning of economy from expansion to recession and from recession to recovery respectively. Since 1995, The Conference Board published composite indices of leading, coincident, and lagging indicators.
First things first. A good rule of thumb for defining a recession is that a recession is two consecutive quarters of the negative real GDP growth. The Composite Index of Coincident Indicators comprises of the variables that are useful to determine the beginning and the end of a recession. These are the economic indicators changing with the current macroeconomic situation. Therefore, they reflect the present state of the economy.
The Index is made up of the four indicators which have been observed to coincide with the turning points of the economy. These four indicators are the number of employees on non-farm payrolls, real personal income less transfer payments from the government, industrial production, and real manufacturing trade and sales. That these components are coincident indicators does make sense because recessions result in the shrinkage of the industrial output, jobs, spending, and income.
Leading indicators are infamous among economists who tend to ignore them. Some even call these variables misleading indicators.
While coincident indicators give information where the economy is at the moment, leading indicators predict where will the economy will be after several months. Not all leading indicators are created equally; strategists and economists distinguish two types of leading indicators — long leading and short leading. Some of them, especially those related to financial markets, such as yield-curve spread, are long leading which means they have longest leading effect on the economy. For example, since 1969 each inversion of the 2s10s yield curve (the difference between 10-year and 2-year Treasury bonds’ yields) resulted in a recession. But the average time it takes to be followed by a recession is 13 months.
On the other hand, with the real economic activity indicators, it typically takes less time to be followed by a recession. That’s why these variables which include but are not limited to building permits, and unemployment claims, are short leading indicators.
The Composite Index of Leading Indicators is made up of the following ten variables:
1. Manufacturing average weekly hours. To understand why this indicator is a leading one, recall that manufacturing is more cyclical than the overall economy. When the economy starts to grow and get out of a recession, producers tend to not expand their workforce because they are not sure that this positive economic trend will continue. So they continue their current employees to work more hours. But eventually, as the economy continues to improve, producers will add to their workforce. The exact opposite happens when the economy goes into a recession. Producers tend to reduce hours worked of employees, not to directly lay-off them. But as the recession deepens, more and more employees will lose their jobs which reinforces the negative trend of the economy.
2. Average number of initial applications for unemployment compensation
3. Average consumer expectations for business conditions
4. Manufacturers’ new orders, consumer goods and materials. Fall in manufacturers’ orders is followed by an economic weakness.
5. Manufacturers’ new orders, nondefense capital goods, excluding aircraft
6. Institute of Supply Management (ISM) Index of New Orders
7. New building permits, private housing units. Residential investment is among the most cyclical sectors of the economy. From the chart we see that building permits tend to fall before recessions.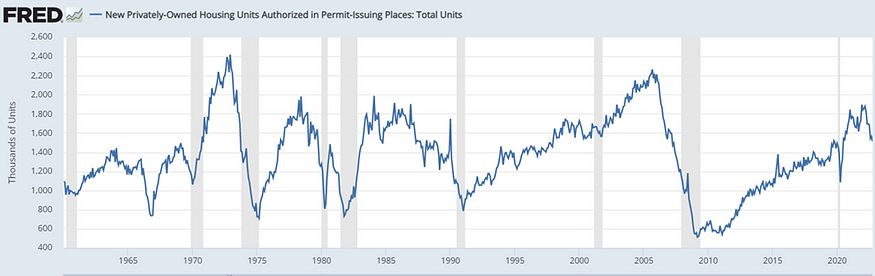 The remaining three indicators are financial market-related:
8. S&P500 index. The stock market is a lea. ing indicator because it anticipates the turning points of all sectors making up the global economy.
9. Leading Credit Index. Tightening credit conditions tend to predict a recession. On the other hand, if credit conditions are easing, we can expect an economic expansion.
10. Yield curve spread.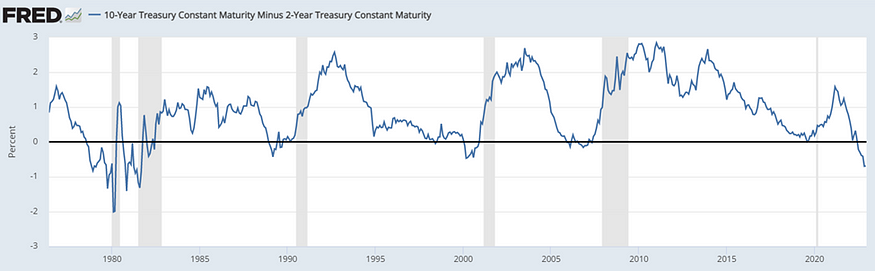 Whenever long-term government bonds have lower yields than short-term bonds, it portends a recession.
Lagging indicators
These indicators tend to follow turning points of the economy and provide confirmation about the dynamics of business cycles. The Composite Index of Lagging Indicators comprises of the following indicators:
1. Commercial and industrial loan volume. As the economy improves, business take more loans and bank credits.
2. Ratio of consumer installment credit to personal income. As the expansion continues, consumers become more confident in their income and jobs which results in taking more credit.
3. Average duration of unemployment (inverted). The growing economy leads to the strong labor market which means that finding a job becomes easier and the average duration of unemployment decreases.
4. Ratio of manufacturing and trade inventories to sales. If business expect that futures sales will improve, they will build inventories relative to current sales.
5. Average rate charged by banks. The credit demand from businesses and consumers increases interest rates.
6. Unit labor costs. As the economy expands, labor costs start to increase. This gradually results in the fall in profit growth and expansion itself.
7. Change in the CPI for services. Unlike commodities, prices of services don’t immediately rise with the increase in demand. There’s typically a much longer lag.
Almost by definition, lagging indicators don’t immediately respond to the change in the economic environment. At the beginning of a recessions they tend do rise, and begin to fall with a longer lag.