What Is Indicator Repainting, and Why It Quietly Wrecks Your Backtest
If you've ever backtested a TradingView indicator that looked incredible on history, then watched it miss or reverse signals in live trading, repainting is one of the most common and least understood reasons why. It's also one of the easiest problems to check for once you know what to look for — yet most traders never run the check, because nothing in a normal charting workflow forces them to.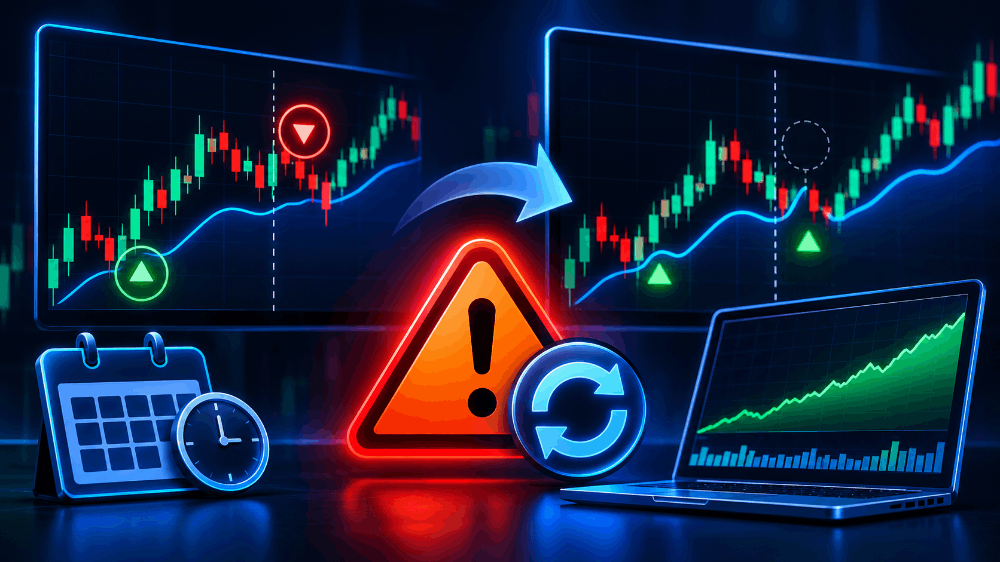
What repainting actually means
Repainting happens when an indicator changes a signal it already displayed, after the fact, once more price data comes in. The signal you saw flash "buy" at 10:15 am might quietly disappear, move to a different bar, or flip to "sell" by 10:20 am — but your memory, and often your screenshot, only recorded the first version. By the time you look back at the chart later, history has been quietly rewritten to show something cleaner and more confident than what actually displayed in real time.
This happens for a few common technical reasons, each worth understanding on its own:
- Using
request.security()without proper offsetting in Pine Script, which can pull in data that wasn't actually available at the time the bar closed — effectively letting the script see slightly into its own future when run on historical data, a look-ahead bias that live trading can never replicate. - Calculating on the still-forming current bar instead of waiting for it to close, so the signal's inputs keep changing until the bar finishes. A signal based on an unfinished bar's high, low or close is based on numbers that are still actively changing — it can look completely different by the time that bar actually closes a minute, an hour, or a day later depending on the timeframe.
- Lookback-based smoothing that references future bars during backtesting, which is mathematically impossible in live trading but can slip into backtest logic by mistake — a common trap in custom indicators that use centred moving averages or certain smoothing filters without accounting for the fact that a centred calculation needs bars on both sides of the point being smoothed, including ones that haven't happened yet at the time the original signal would have fired live.
- Zig-zag and pivot-based drawing logic that, by design, can only confirm a swing high or low once enough bars have passed afterward to prove it was actually the high or low point. This is a legitimate and common charting technique, but it inherently repaints the most recent swing point by definition, and traders sometimes mistake this specific, disclosed kind of repainting for the live-signal kind described above.
Why this makes backtests lie
A backtest run on a repainting indicator is testing against information that didn't exist yet when each signal supposedly fired. The system "knew" the bar's final close, or a future swing point, before that information actually existed in real time. This can inflate win rates dramatically — sometimes a strategy that looks like 70% accurate in backtest turns out to be closer to a coin flip live, because the backtest was quietly cheating with hindsight it wouldn't have had in real time.
This is also why so many trading tool reviews online are unreliable — a screenshot of a historical chart with signals marked on it proves almost nothing, because you can't tell from the screenshot whether those signals would have looked identical in real time, or whether the chart has quietly repainted itself into a tidier, more impressive-looking version since the screenshot was taken.
The gap between backtested and live performance isn't always obvious immediately either. A repainting strategy can perform reasonably for a stretch of live trading purely by chance, which delays the moment a trader notices something is wrong and makes the eventual disappointment feel more like "bad luck" than what it actually is — a structural flaw in how the signal was generated in the first place.
How to actually test for it
The only reliable check is TradingView's Bar Replay feature, and it takes about five minutes per indicator once you've done it a couple of times:
- Open Bar Replay and pick a starting point a few weeks back — far enough back that you'll see a reasonable number of signals during the replay, but recent enough that the price behaviour is still relevant to current conditions.
- Step forward one bar at a time and watch exactly when and where each signal appears. Note the bar it appears on and whether it stays put as subsequent bars form.
- Once you reach the present, compare what you saw bar-by-bar against what the regular chart shows for that same period now, with all the "future" data already loaded.
- If any signal moved, appeared somewhere different, or disappeared between the two views, the indicator repaints. If every signal you watched appear during the replay matches exactly where it sits on the regular chart afterward, that's a strong sign the indicator is genuinely non-repainting, at least for the window you tested.
Do this before you commit real capital to any signal-based tool, free or paid, and before you trust any backtest numbers tied to it. It's worth repeating this test across more than one stretch of history too — a single clean pass through one calm period doesn't fully rule out repainting behaviour that only shows up during a sharp, fast-moving move, since some repainting logic is more likely to trigger exactly during the volatile conditions that most matter to a live trader.
Why screenshots and forum posts can't substitute for this test
A static image of a chart with signal arrows marked on it is, by its nature, incapable of proving whether those arrows repainted — the image only shows the final, settled state of the chart after all the data has already arrived. A forum post claiming "this indicator called the exact top" based on a screenshot taken after the fact tells you nothing about whether that exact signal was visible, in that exact position, at the moment it would have mattered for a live trade.
This is precisely why Bar Replay, which recreates what the chart actually looked like bar by bar as it was forming, is the only test that actually answers the question. Video demonstrations are somewhat more convincing than static screenshots, but even then, it's worth confirming the video shows a true Bar Replay session rather than a backtest result rendered after the fact and simply narrated as if it were live.
Repainting isn't always disqualifying — but hiding it is
Some indicators are explicitly designed to repaint and are upfront about it — for example, certain pivot or zig-zag style tools that only make sense in hindsight and are marketed for that purpose, as mentioned earlier. That's fine, as long as you know what you're looking at and aren't using it to trigger live entries based on a signal that hasn't actually confirmed yet.
The real problem is tools marketed as live signal generators that repaint silently, with no disclosure, because the win-rate numbers in their marketing materials were generated by a backtest that had access to future data it wouldn't have had in real time. The disclosed, intentional kind of repainting and the hidden, undisclosed kind look identical on a screenshot — the only way to tell them apart is the vendor's own disclosure, checked against your own independent Bar Replay test.
A related issue: recurring cost on top of unreliable signals
Repainting problems are frustrating enough on their own. They become worse when paired with an ongoing subscription cost, since you're paying every month for signals you can't fully trust. This combination — subscription pricing plus unverified repainting behaviour — is a pattern worth specifically checking for in any charting toolkit before committing, because a subscription model means the cost of an undetected repainting problem compounds every billing cycle rather than being a single sunk cost from a one-time purchase.
One category comparison that walks through this exact combination in a specific tool evaluation is this look at FluxCharts and its alternatives, useful as a case study in what to ask a vendor before paying for recurring signal access.
How repainting interacts with different indicator types
Repainting risk isn't evenly distributed across every kind of indicator — some categories are structurally more prone to it than others, which is useful to know when deciding where to focus your testing effort.
- Trend-following indicators built on confirmed bar closes (a basic moving average crossover, for instance) are generally lower risk, since there's little incentive for a developer to reference unfinished data — the logic is simple enough that look-ahead bugs are less likely to creep in unnoticed.
- Multi-timeframe indicators that pull data from a higher timeframe onto a lower one are a common source of accidental repainting, because the higher timeframe's "current" bar is still forming while the lower timeframe ticks forward, and handling that correctly requires deliberate, careful offsetting that not every developer gets right.
- Pivot, zig-zag, and swing-point indicators are inherently and often intentionally repainting by design, as covered above — the test here is whether the vendor discloses this clearly, not whether the behaviour exists at all.
- Machine-learning or scoring-based signal tools can be harder to audit for repainting from the outside, since the internal logic is less transparent than a simple formula — this is one more reason to insist on a Bar Replay test specifically for this category rather than relying on a description of the methodology alone.
Common mistakes traders make around repainting
- Testing only once, on a single calm stretch of history. Repainting behaviour can be inconsistent — present during fast, volatile moves and absent during quiet ones. A single clean test on a calm period isn't conclusive.
- Trusting a vendor's written claim without independent verification. Even well-intentioned vendors sometimes don't realise their own tool repaints in certain conditions, because they tested it the same limited way a buyer might.
- Confusing a disclosed, intentional repainting tool (like a zig-zag) with a hidden one. The visual result can look the same on a chart; the difference is entirely in disclosure and in how the tool is meant to be used.
- Assuming a free indicator is more likely to repaint than a paid one, or vice versa. Price has no inherent relationship with whether a tool repaints — both free and paid indicators exist in both categories, and the only way to know is to test.
- Giving up on the Bar Replay test because it's "too technical." The procedure itself requires no coding and no special knowledge — just patience to step through bars one at a time and compare notes afterward.
A concrete walk-through of a repainting bug, step by step
It helps to see the mechanics of a repainting bug laid out concretely rather than described abstractly, since "look-ahead bias" can sound more theoretical than it actually is in practice.
Imagine a simple custom indicator meant to mark a bar as a local high if the bar's close is higher than the closes of the two bars before it and the two bars after it — a basic five-bar centred pattern. On historical data, this calculation works perfectly: all five bars already exist, so the script can look two bars forward and two bars back from any given point and mark the pattern cleanly. The backtest shows a series of neatly marked, confirmed local highs, and the strategy built around trading reversals at those marked highs looks accurate.
The problem appears the moment this same logic runs live. At the instant a candidate bar closes, the two bars "after" it haven't happened yet — they don't exist. The indicator cannot actually mark that bar as a local high until two more bars have closed, which means in live trading the signal necessarily arrives two bars late compared to how it appeared in the backtest, where it could look two bars into its own future. The backtest and the live version of the exact same code are answering two different questions: "was this a local high, confirmed instantly" (impossible, and this is what the backtest secretly did) versus "was this a local high, confirmed two bars later" (what live trading actually delivers). A trader who only ever looked at the backtest chart, where the marks appear to land exactly on the peak, has no way to see this two-bar lag baked into the underlying method.
This exact pattern — correct math, applied to data that doesn't yet exist at decision time — is the mechanism behind the large majority of repainting bugs, whether in a simple custom script or a more elaborate commercial indicator. Understanding this one example makes it much easier to recognise the same underlying issue when it's hidden inside more complex logic, including the request.security() and multi-timeframe cases mentioned earlier.
What a non-repainting version of the same logic looks like
A corrected version of the local-high example above would simply wait — the script tracks a candidate high as "unconfirmed" and only marks it as a genuine local high two bars later, once the bars needed to confirm it have actually closed. Visually, on a live chart, this means the marker appears two bars after the actual peak rather than exactly on it. That's a meaningfully less flattering, less dramatic-looking chart than the repainting version. It's also an honest one — exactly what a trader would have actually seen and could have actually acted on in real time.
This trade-off — a less visually impressive but honest signal versus a dramatic-looking but dishonest one — is really the whole story of repainting in a single sentence. Any time an indicator's marketing materials show signals landing with unusually precise, pinpoint timing on major turns, it's worth asking specifically how the tool could have known that in real time, not just after the fact.
Three questions to ask before trusting any signal tool
- Has the vendor explicitly stated it is non-repainting, and can you verify that yourself with Bar Replay across more than one stretch of history, including at least one volatile period?
- Were the backtest results shown to you generated with the same logic running live, or a different "lookback-aware" version that has access to data a live version wouldn't have?
- If a signal appeared and then vanished for you personally while live trading, did the vendor explain why in technical terms, or just not mention it at all?
Frequently asked questions
Does every TradingView indicator repaint to some degree?
No — a correctly written indicator that only calculates on confirmed, closed bars does not repaint. Repainting is a specific coding pattern or design choice, not an unavoidable property of all charting software.
Can a strategy be profitable in backtest and also non-repainting?
Yes, and this is exactly what you want to confirm before trusting any backtest result — a genuinely non-repainting strategy's backtest numbers reflect what would have actually been visible and tradeable in real time, which is a far more honest basis for a trading decision than numbers generated with hindsight baked in.
Is Bar Replay available on all TradingView plans?
Bar Replay availability depends on which pricing plan you're on; check the current terms directly on TradingView's own site, since plan features can change over time.
If an indicator repaints only slightly, does it still matter?
Yes — even a small amount of repainting on the most recent bar or two can meaningfully distort a backtest's apparent win rate and risk/reward profile, especially on shorter timeframes where a large share of signals occur near the most recent bars at any given testing cutoff.
Is repainting the same thing as a strategy simply losing money in live trading?
No — a non-repainting strategy can still lose money live for entirely ordinary reasons, including bad luck, a genuine edge that's too small to survive costs, or changing market conditions. Repainting specifically refers to the signal itself displaying differently in hindsight than it did in real time, which is a distinct problem from a strategy's underlying edge simply not holding up.
Does repainting only affect buy/sell arrow-style indicators?
No — it can affect any indicator whose displayed value depends on data that wasn't fully available at the time it was drawn, including trend lines, support/resistance bands, oscillator readings, and background colour shading used to signal a regime, not just explicit arrow markers.
Why this matters even more for options sellers than for directional traders
For a trader buying or selling the underlying instrument directly, a repainting signal that arrives a bar or two late is a meaningful problem, but the trade itself still has the same basic structure regardless of exactly when it's triggered. For an options seller specifically, timing precision matters more, because premium, time decay and the specific strike selected all depend heavily on exactly when a position is opened relative to the rest of the session. A signal that looked like it fired at a specific favourable moment in a repainting backtest, but would have actually confirmed several minutes or several bars later in real time, can mean an options seller enters at a meaningfully different point in the day's volatility and time-decay curve than the backtest implied — directly affecting the premium collected and the risk taken on, not just whether the trade direction was eventually correct.
Five minutes with Bar Replay before you trust any indicator's track record will save you from a lot of disappointing live trading later, and it's one of the very few checks in trading that is both completely free and fully within your own control, regardless of how much you trust or distrust a given vendor.
This article is for educational purposes only and is not investment advice. Always verify any indicator's behaviour independently before trading with real capital.