Solana (SOL) Market Analysis: Short-Term Momentum Building — But What’s Next?
The crypto market never sleeps and neither does volatility. Let’s take a closer look at Solana (SOL) based on the 15-minute timeframe and break down what the current price action is telling us.
At the time of analysis: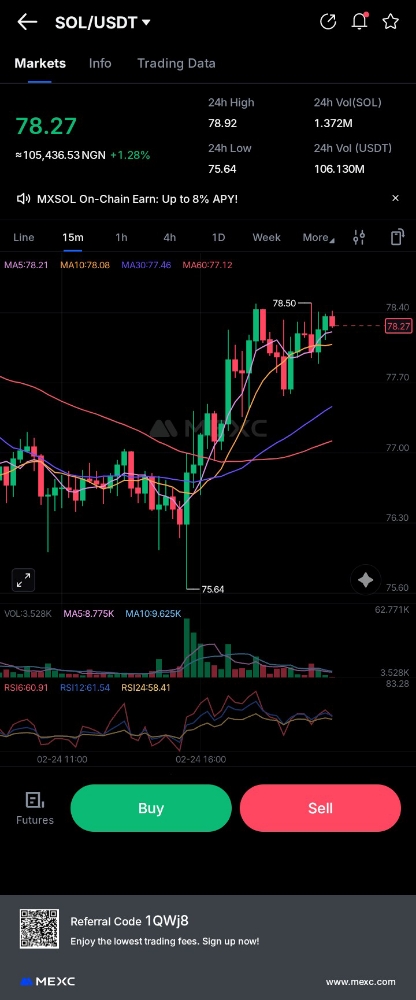
24H High: $78.92
24H Low: $75.64
Short-Term Trend: Bullish Momentum Emerging
SOL recently bounced strongly from the $75.64 level and began forming higher highs and higher lows, a classic sign of short-term bullish structure.
Price is currently trading above: MA5, MA10, MA30, and MA60
When price holds above multiple moving averages on a lower timeframe, it signals short-term strength. However, it’s important to remember that the 15-minute chart reflects intraday movement not the bigger macro trend.
Volume Analysis: Momentum Slowing?
The move from $76 to $78.50 was supported by a noticeable spike in volume. That’s a healthy sign strong moves need strong participation.
However, volume has started to decrease.
When this happens, it typically means:
Buyers are becoming cautious
The market is deciding between continuation or pullback
Momentum may temporarily cool off
A breakout without strong volume confirmation can fail quickly.
🔥 RSI (Relative Strength Index): Room to Move
The RSI is hovering around 60–62.
This tells us:
The market is not overbought
There’s still room for upward movement
Momentum is positive but not extreme
Bigger Picture Matters
Short-term charts are useful for traders, but long-term investors should zoom out.
Solana is known as a high-beta asset — meaning it tends to move aggressively with broader market sentiment. Its direction is heavily influenced by:
The strength of Bitcoin
Overall crypto risk appetite
Macro market conditions
If Bitcoin is stable or bullish, SOL often amplifies that move.
Conclusion:
In the short term, Solana shows bullish structure with slowing momentum. The next move will likely depend on whether buyers can push through the $79 resistance with conviction.
For traders: watch volume and resistance levels closely.
For long-term investors: the 15-minute chart is noise — focus on daily and weekly trends.
As always in crypto, manage risk carefully. Momentum can shift quickly, especially in volatile markets.