Wyckoff ‘SOS’ Could Catapult Bitcoin To $100,000: Hedge Fund Manager

Charles Edwards, founder of the Bitcoin and digital asset hedge fund Capriole Investments, published a detailed examination of Bitcoin’s current market phase suggesting a bullish trajectory, potentially reaching the $100,000 mark. The analysis hinges on the identification of a Wyckoff ‘Sign of Strength’ (SOS), a concept derived from the century-old Wyckoff Method that studies supply and demand dynamics to forecast price movements.
Understanding The Wyckoff ‘SOS’: Bitcoin To $100,000?
The Wyckoff Method, developed by Richard D. Wyckoff, is a framework for understanding market structures and predicting future price movements through the analysis of price action, volume, and time. The ‘Sign of Strength’ (SOS) within this methodology signifies a point where the market shows evidence of demand overpowering supply, indicating a strong bullish outlook.
Edwards’s observation of an SOS pattern in Bitcoin’s recent price movements suggests that the market is at a pivotal point, where sustained upward momentum is highly probable. In Capriole’s latest newsletter, Edwards offered a precise depiction of Bitcoin’s market behavior, highlighting a period of volatility and consolidation in the $60,000 to $70,000 range.
Related Reading: Bitcoin Bull Flag Could Predict 10% Surge To $77,000, Analyst Explains
This phase was anticipated by the hedge fund. Currently, as Bitcoin ventures above its last cycle’s all-time highs, it aligns with the predicted zig-zag SOS structure. Edwards elucidates, “It would not be surprising to see a liquidity grab at / into all-time highs […] All consolidation above the Monthly level at $56K is extremely bullish. It would be uncommon (but not impossible) for price to continue in a straight line up.”
The “zig-zag” phase also perfectly aligns with the halving cycle as BTC tends to consolidate “both months either side of the Halving.” Edwards added that “the realities of a much lower supply growth rate + unlocked pent up tradfi demand will then kick-in and launch 12 months of historically the best risk-reward period for Bitcoin.”
From a technical perspective, Bitcoin’s foray into price discovery territory above $70,000 is devoid of significant resistance levels. This opens a pathway to psychological and Fibonacci extension levels, with Edwards pinpointing $100,000 as the next major psychological resistance.
Related Reading: Bitcoin ETF Inflows Could Eclipse $1 Trillion, Predicts Bitwise CIO
The 1.618 Fibonacci extension from the 2021 high to the 2022 low is noted at $101,750, serving as a technical marker for potential resistance. Edwards reflects on investor sentiment, stating, “You can also imagine quite a few investors would be happy seeing six-digit Bitcoin and taking profit in that zone,” acknowledging the psychological impact of such milestones.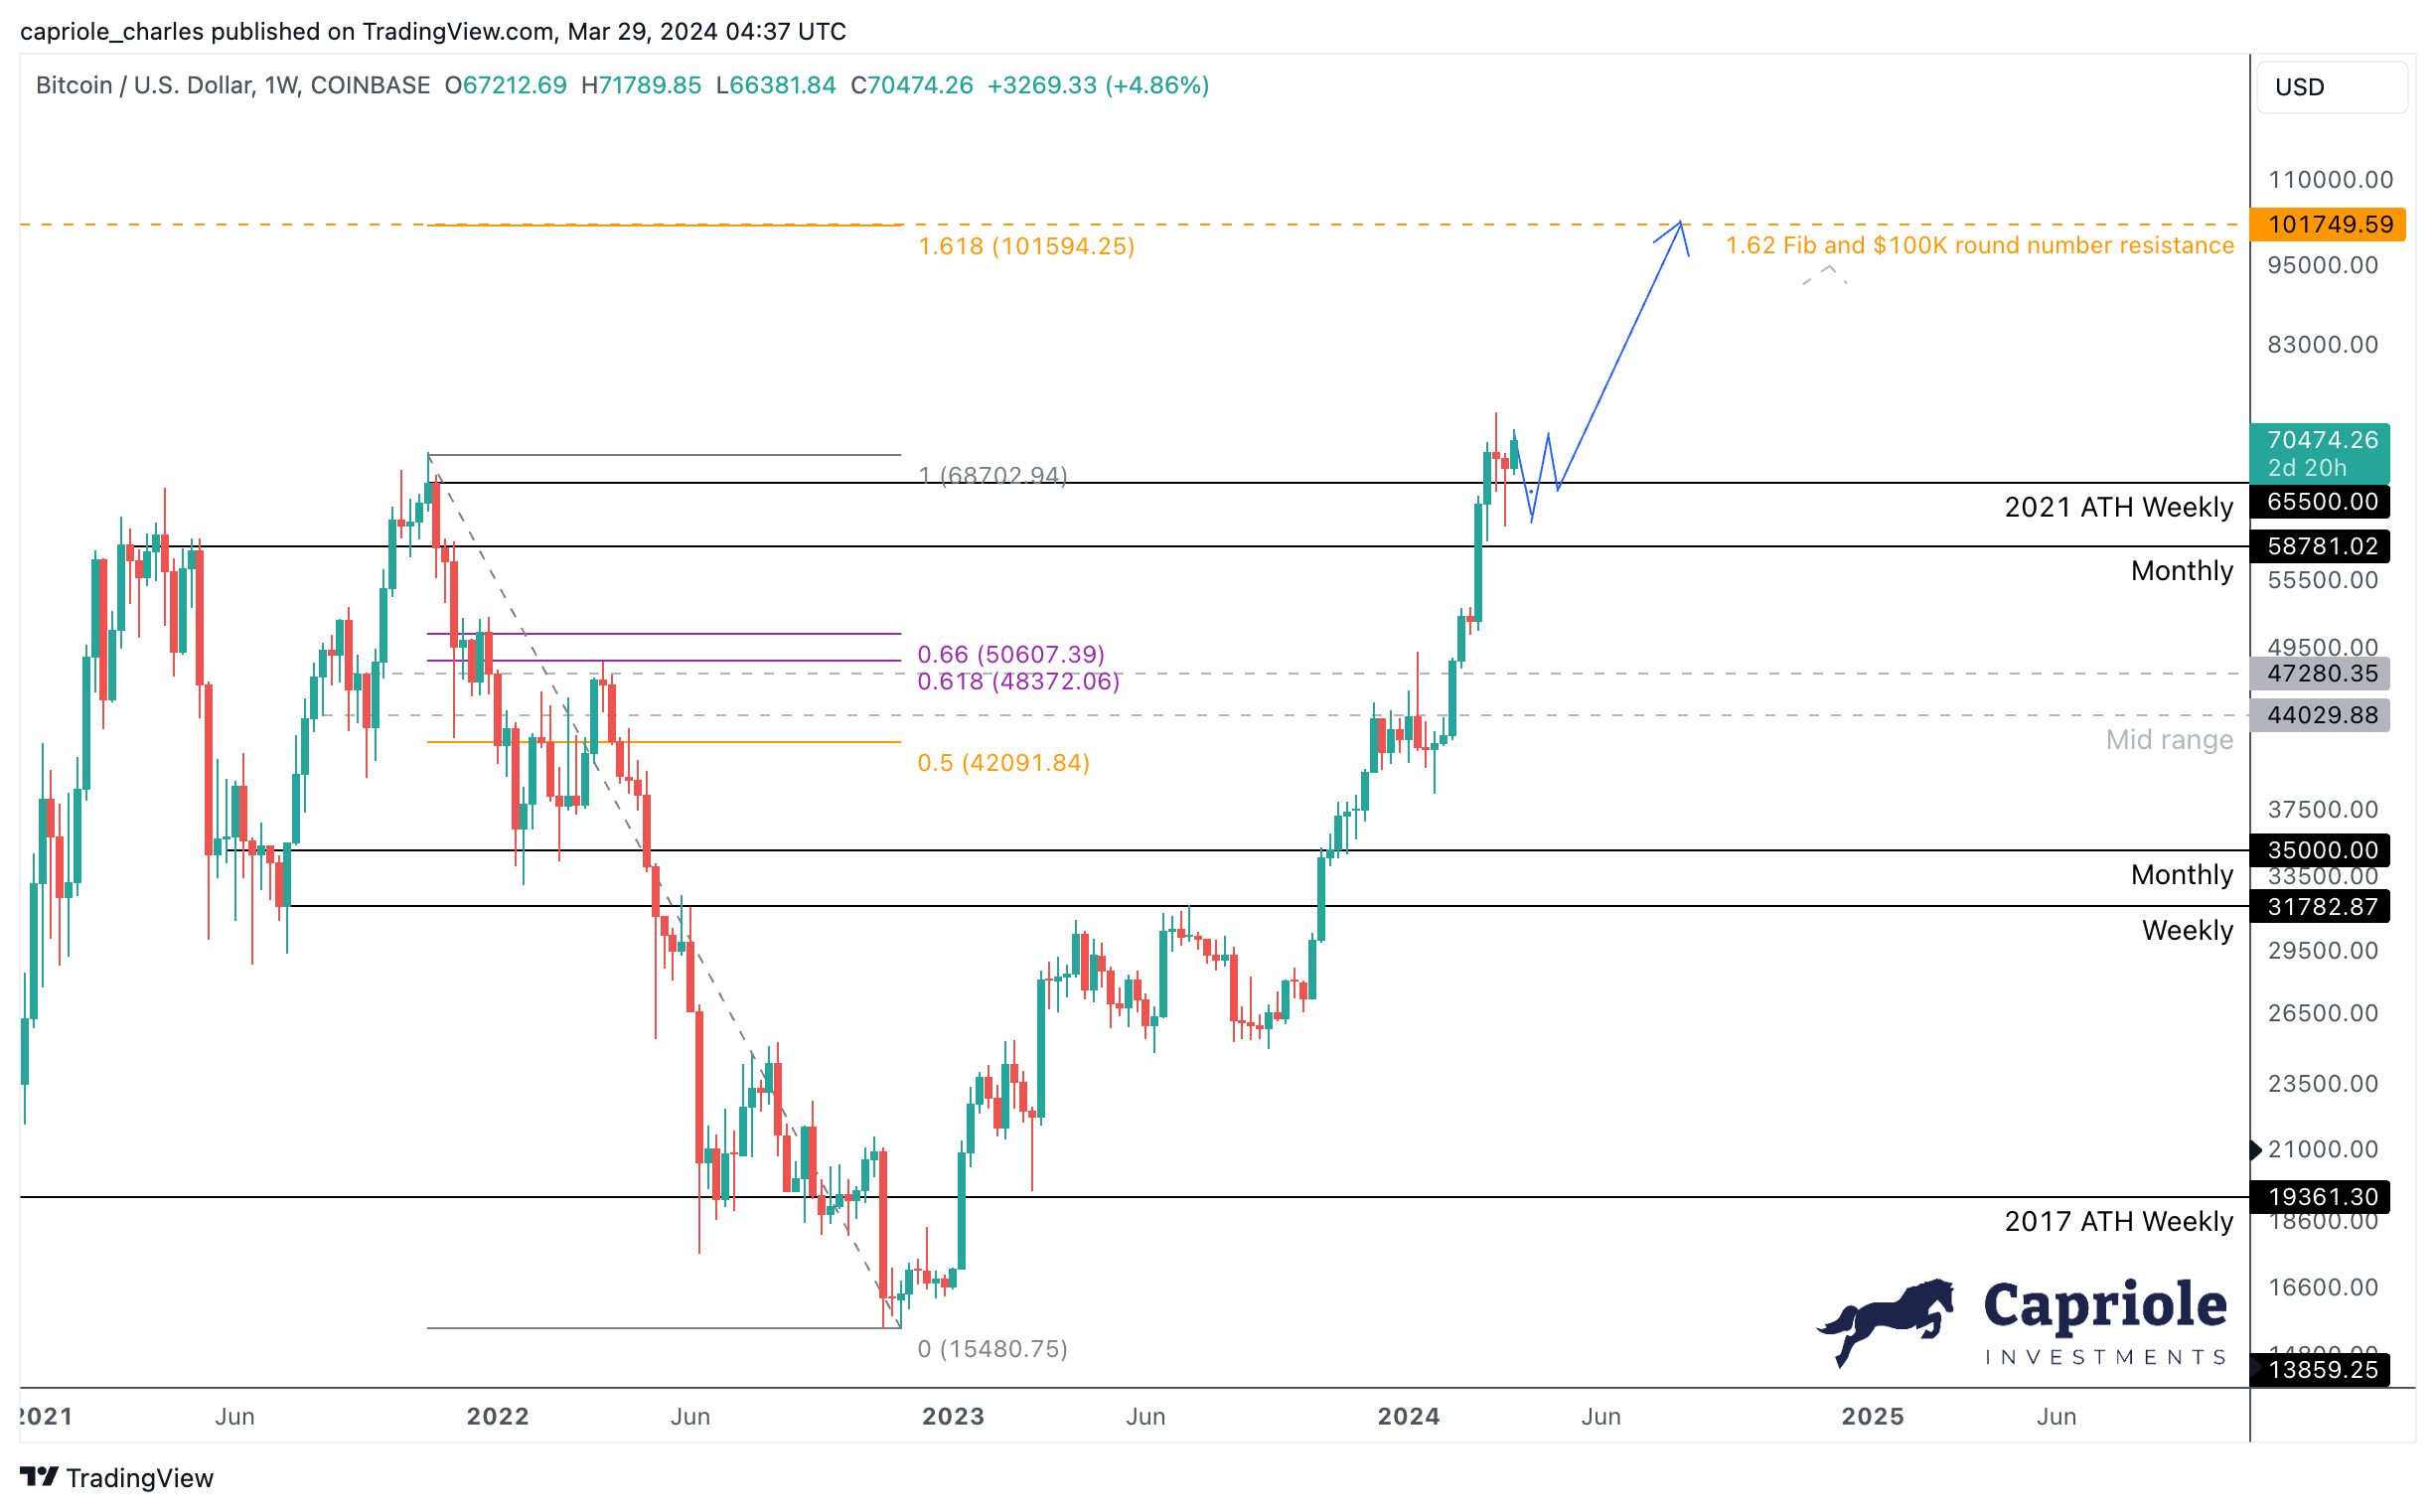 Bitcoin price analysis | Source: Capriole Investments
BTC Fundamentals Support The Bull Case
Edwards also delves into the importance of fundamentals, underscoring their role in providing a bullish backdrop for Bitcoin. The introduction of the Dynamic Range NVT (DRNVT), a unique metric to Capriole, indicates that Bitcoin is currently undervalued. Edwards describes DRNVT as “Bitcoin’s ‘PE Ratio'”, which assesses the network’s value by comparing on-chain transaction throughput to market capitalization.
The current DRNVT readings suggest an attractive investment opportunity, given Bitcoin’s undervaluation at all-time price highs. “What’s fascinating at this point of the cycle is that DRNVT is currently in a value zone. With price at all time highs, this is a promising and unusual reading for the opportunity that lies ahead in 2024. It’s something we didn’t see in 2016 nor 2020,” Edwards remarked.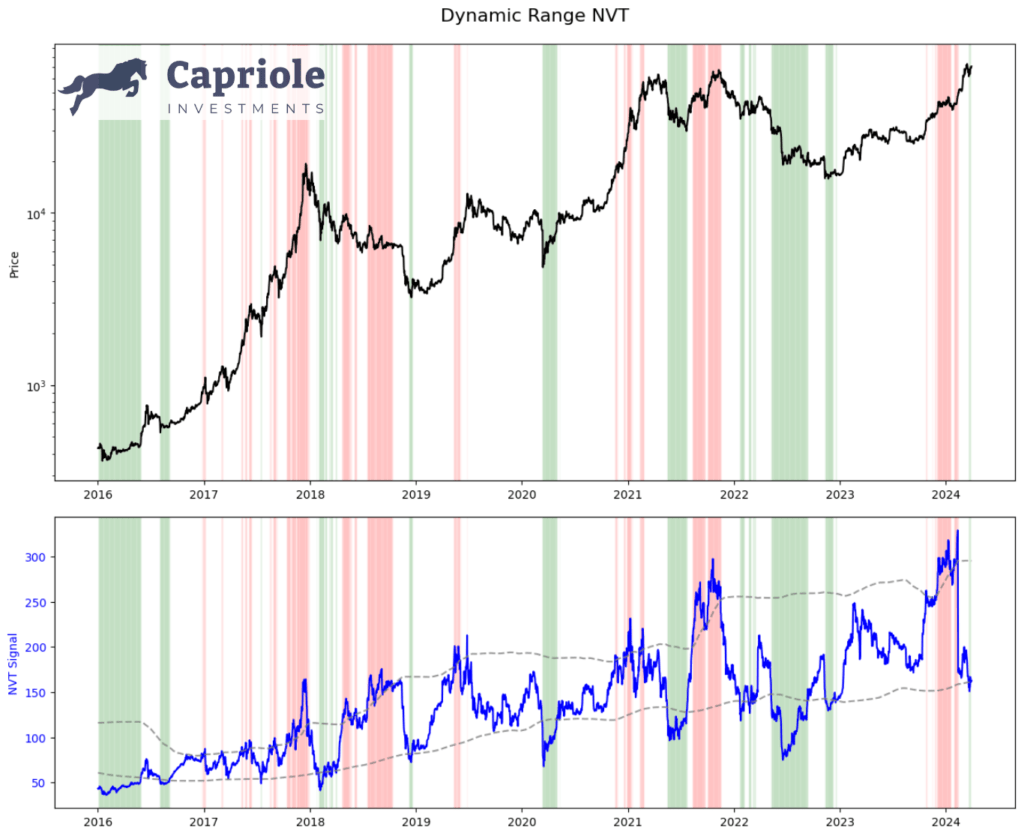 Bitcoin Dynamic Range NVT | Source: Capriole Investments
With both technical indicators and fundamental analysis signaling a bullish future for Bitcoin, the anticipation surrounding the upcoming Halving event adds further momentum to the positive outlook. Despite the expectation of volatility and consolidation in the short term, Edwards confidently states, “probabilities are starting to skew to the upside once again.”
At press time, BTC traded at $69,981.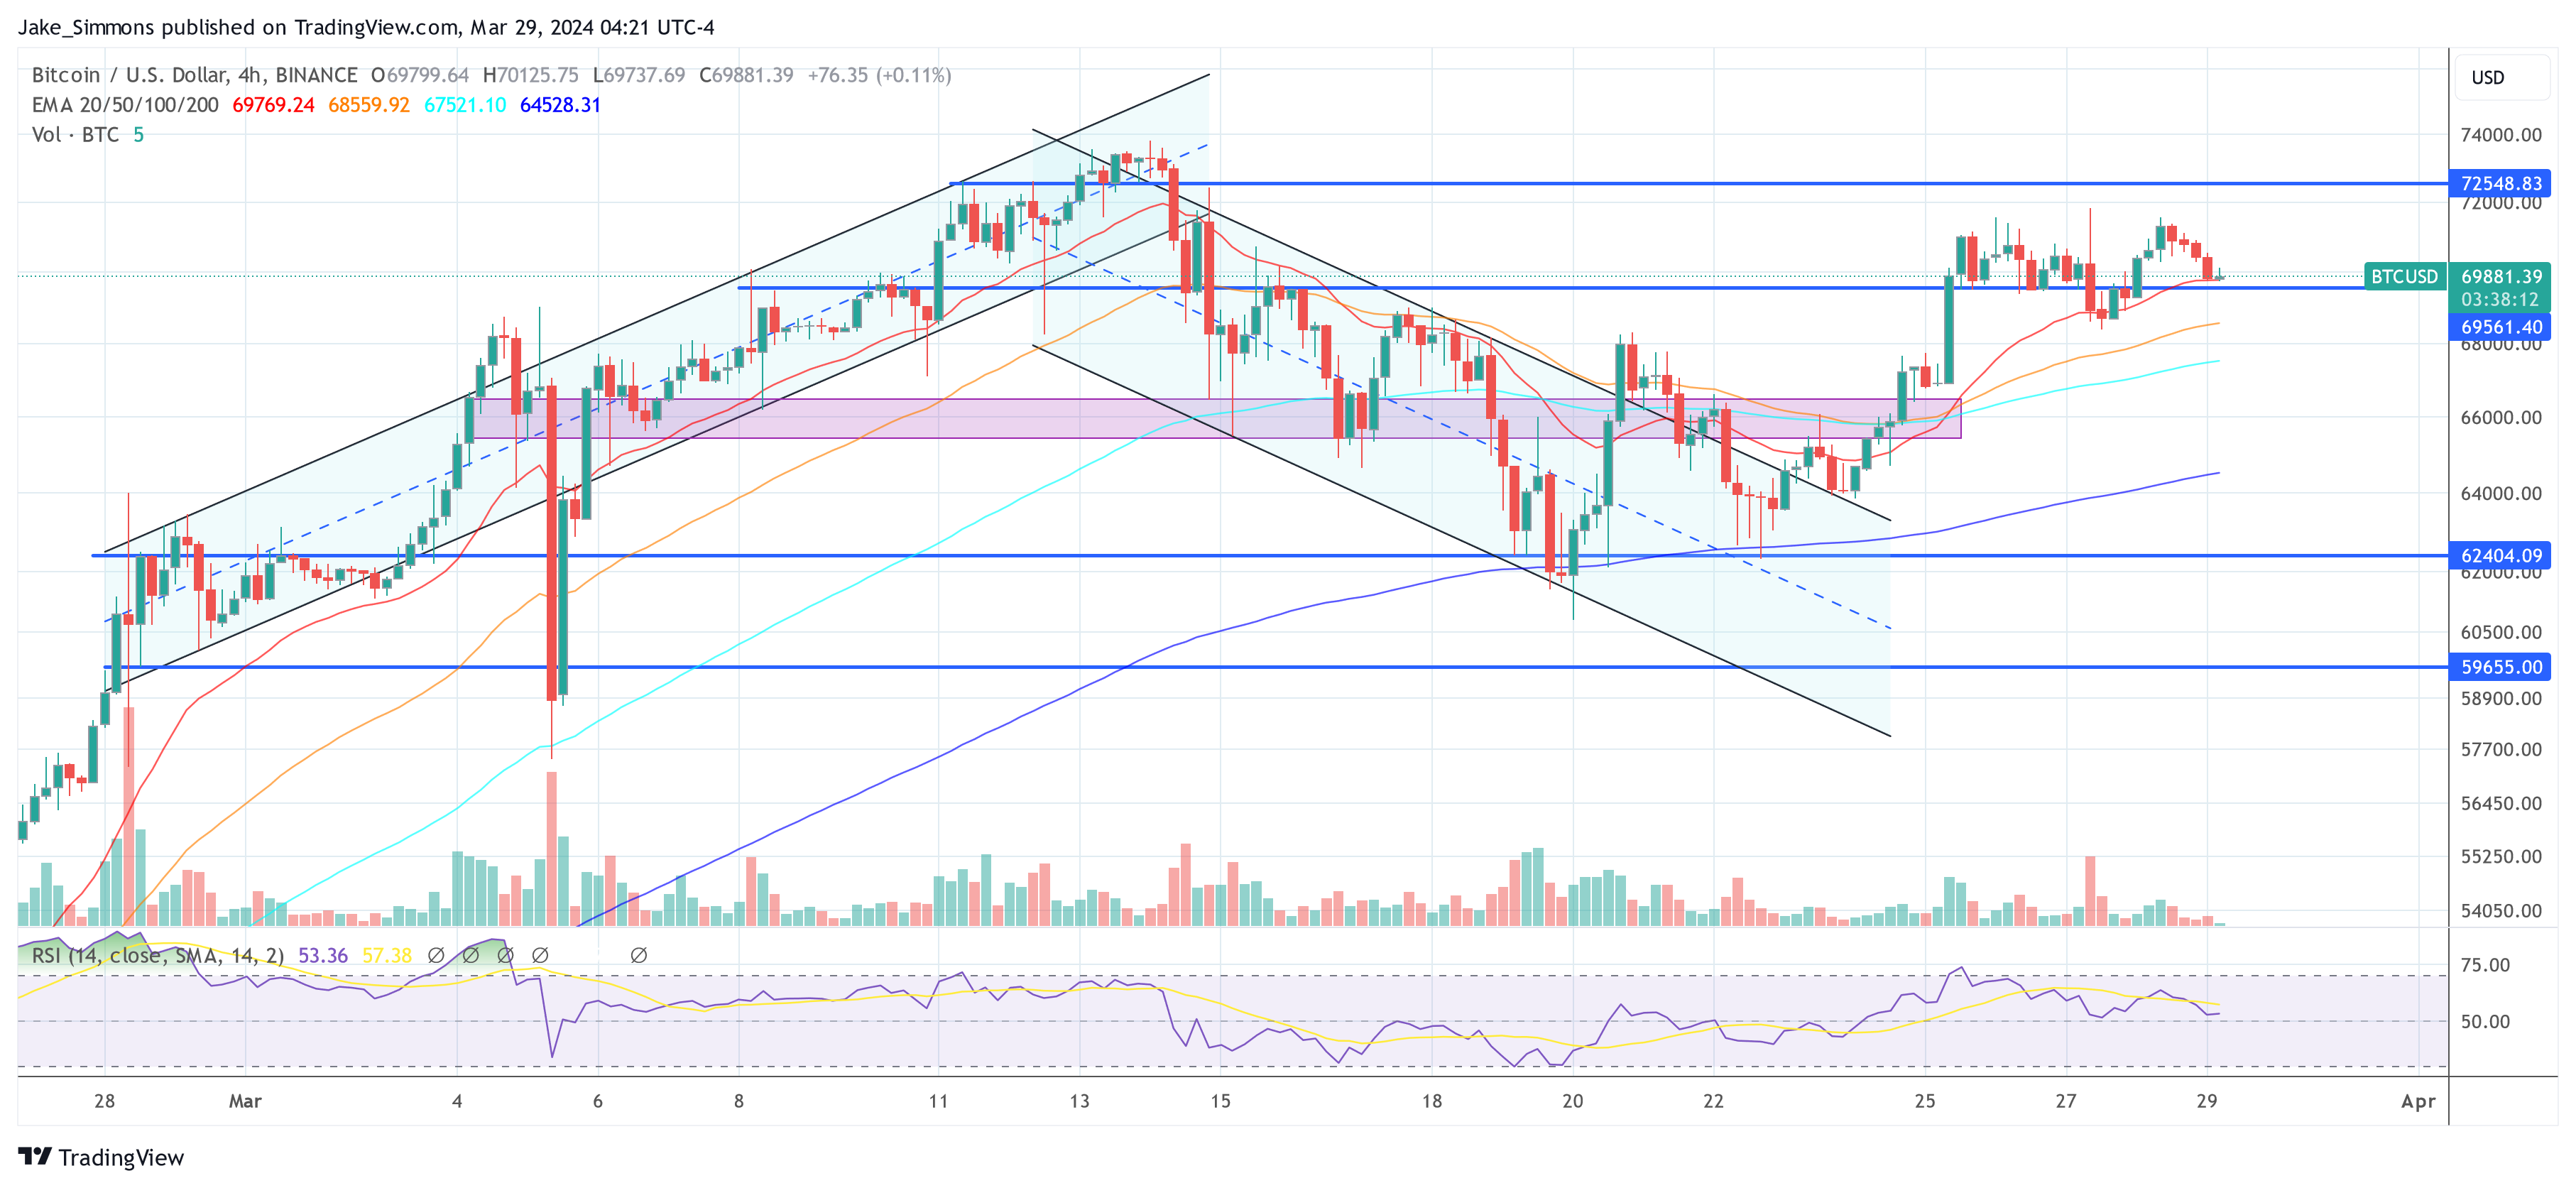 BTC price, 4-hour chart | Source: BTCUSD on TradingView.com
Featured image from Shutterstock, chart from TradingView.com
Disclaimer: The article is provided for educational purposes only. It does not represent the opinions of NewsBTC on whether to buy, sell or hold any investments and naturally investing carries risks. You are advised to conduct your own research before making any investment decisions. Use information provided on this website entirely at your own risk.
Tags: bitcoinBitcoin Halvingbitcoin pricebitcoin price predictionbtcbtc priceCapriole InvestmentsCharles Edwards
Dogecoin Jumps 37% – How High Can DOGE Go This April?
Retail and institutional investors alike are taking notice as Dogecoin (DOGE), the playful cryptocurrency born from internet fame, experiences a surprising surge.
Prices jumped almost 10% in a single day this week, marking a 37% increase over the past seven days, according to CoinGecko. This unexpected rally has the “Doge army” howling with excitement, but experts caution that the future of this meme-inspired coin might not be all sunshine and rainbows.
DOGE up nearly 10% in the last day. Source: Coingecko
From Meme To Market Mover
Dogecoin, launched in 2013 as a lighthearted parody of Bitcoin, has defied expectations. It has evolved into a symbol of community-driven digital currency, attracting a passionate following. However, despite its recent rise, Dogecoin remains far from its peak of $0.73 reached in May 2021.
Related Reading: Bullish Winds Blow: Bitcoin Bull Flag Points To New $77,000 ATH: Analyst
Technically, Dogecoin seems to be finding support at $0.1599, a level that previously saw a rebound. On the other hand, resistance is visible near the recent high of $0.2184. As the weekend approaches, speculation runs rampant. Some analysts predict a potential dip of 6-7% for DOGE in the coming days.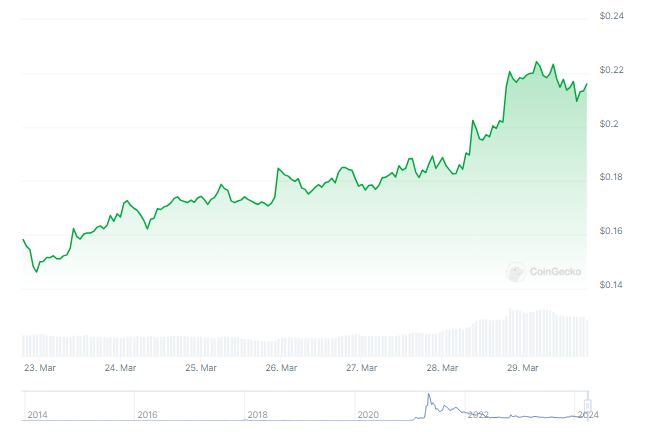
DOGE putting up impressive numbers in the weekly timeframe. Source: Coingecko.
This forecast reignites the debate about the forces driving Dogecoin’s price. While the coin boasts a fiercely loyal community and undeniable brand recognition, its value remains susceptible to the whims of the crypto market. Speculative trading, investor sentiment, and broader market trends all play a significant role.
Social Media’s Pawprints And Elon’s Tweets
Social media and celebrity endorsements, particularly those from Tesla CEO Elon Musk, have undeniably shaped Dogecoin’s dramatic price swings. Musk’s tweets, often laced with humor and references to the Doge meme, have triggered sudden buying sprees, leading to periods of intense volatility.
DOGE market cap currently at $31 billion on the weekend chart. Chart: TradingView.com
Also, recent whale activities have accompanied Dogecoin’s price rise. The increase in activity, as seen in on-chain market dynamics, has boosted investor confidence in Dogecoin. The rise in whale accumulation shows how huge holdings influence cryptocurrency market trends and prices.
Related Reading: From $90 To $400 Litecoin: Analysts Bullish On LTC Soaring Trajectory
Meanwhile, Dogecoin’s adoption by Coinbase Derivatives marks a major shift in thinking, recognising its rise from a fanciful internet phenomena to a crypto asset.
Dogecoin’s longevity and expansion beyond meme status indicate growing institutional and retail investor adoption. As anticipation grows for the Coinbase IPO, Dogecoin’s recent gain shows its endurance and attractiveness in the ever-changing cryptocurrency world.
Featured image from Pixabay, chart from TradingView
Disclaimer: The article is provided for educational purposes only. It does not represent the opinions of NewsBTC on whether to buy, sell or hold any investments and naturally investing carries risks. You are advised to conduct your own research before making any investment decisions. Use information provided on this website entirely at your own risk.
Tags: altcoinscryptodogeDogecoinmemecoin
Bullish Winds Blow: Bitcoin Bull Flag Points To New $77,000 ATH: Analyst
Bitcoin (BTC) is poised for a potential surge after forming a bullish technical pattern and attracting a wave of institutional investment. The world’s leading cryptocurrency recently surpassed the $70,000 mark, setting the stage for a possible breakout that could eclipse its current all-time high of $73,750.
Related Reading: From $90 To $400 Litecoin: Analysts Bullish On LTC Soaring Trajectory
This optimistic outlook comes from analyst Ali Martinez, who identified a bull flag pattern on Bitcoin’s 4-hour chart. This technical indicator typically follows a significant price increase and signifies a consolidation period with a slight downward trend. However, the decreasing trading volume during this phase suggests a temporary pause rather than a reversal, potentially leading to a renewed uptrend.
Validating The Bull Flag Pattern: Bitcoin Consolidation Phase Analysis
Bitcoin’s recent dip below $61,000 served as a testing ground for this theory. The cryptocurrency demonstrated resilience by rebounding into the $67,000-$70,000 range, solidifying the potential validity of the bull flag pattern. This consolidation phase is crucial for market participants to reassess their positions and gauge overall investor sentiment.
#Bitcoin appears to be breaking out of a bull flag on the 4-hour chart! If $BTC holds above $70,000, we could see a surge of nearly 10% to a new all-time high of $77,000! pic.twitter.com/MPVB70p9DU
— Ali (@ali_charts) March 28, 2024
The recent dip wasn’t necessarily a cause for alarm, explained Martinez. In fact, it could be interpreted as a healthy consolidation that strengthens the foundation for further growth.
Beyond technical analysis, a significant shift in Bitcoin’s ownership structure is fueling optimism. The long-awaited launch of spot Bitcoin Exchange Traded Funds (ETFs) in the United States has opened the door for institutional investors. These professionally managed funds, backed by major financial institutions, are estimated to hold a combined 5% of the total Bitcoin supply.
Total crypto market cap is currently at $2.545 trillion. Chart: TradingView
On-chain data further corroborates this institutional influx. CryptoQuant, a blockchain analytics firm, reports a deviation from past bull cycles. Traditionally, Bitcoin ownership flowed from existing large holders (“whales”) to retail investors. However, the current market cycle appears to be witnessing a transfer from these whales to new whales – traditional financial institutions.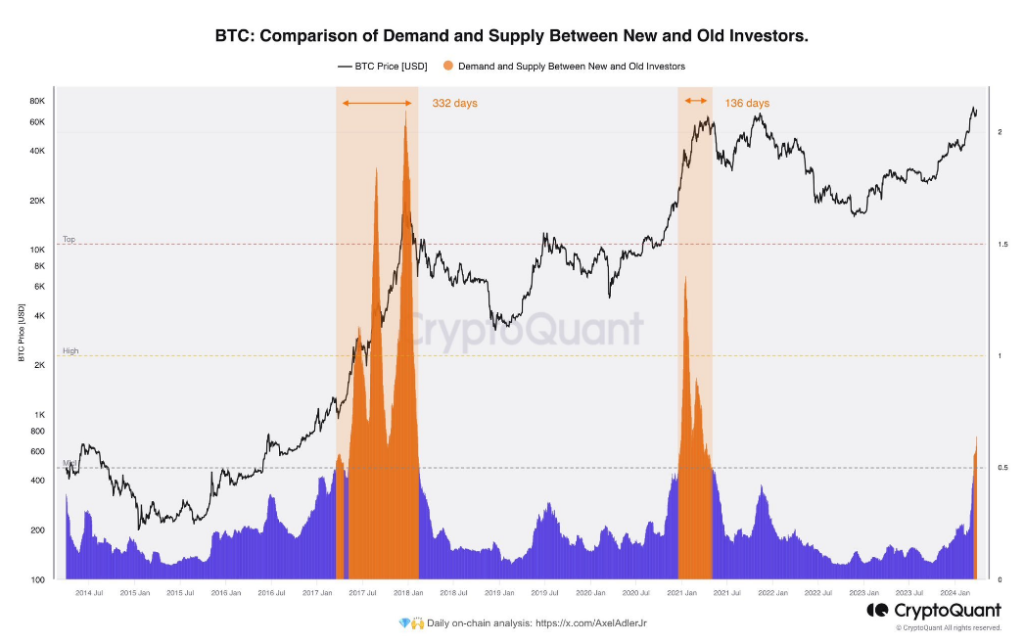
Bitcoin’s Bullish Price Predictions
The influx of institutional capital has emboldened some analysts to make bullish price predictions. While Martinez refrained from offering a specific timeframe for the anticipated breakout above $73,750, others are more forthcoming. Optimistic forecasts range from $100,000 to $150,000 for Bitcoin by the end of 2024, with some even predicting a staggering price of $500,000 by 2025.
Related Reading: Fantom: Market Slowdown Chops Off 10% From Gains – Here’s Why
However, experts caution against blindly following such extreme predictions. The cryptocurrency market remains inherently volatile, and technical analysis is not a foolproof method for guaranteeing future price movements. The long-term impact of institutional involvement on market dynamics is also yet to be fully understood.
Despite these words of caution, the confluence of a bullish technical pattern and a surge in institutional investment has undeniably created a sense of excitement surrounding Bitcoin. As the world’s leading cryptocurrency continues its ascent towards uncharted territory, all eyes are on whether it can indeed break new ground and establish a new all-time high.
Featured image from Pexels, chart from TradingView
Disclaimer: The article is provided for educational purposes only. It does not represent the opinions of NewsBTC on whether to buy, sell or hold any investments and naturally investing carries risks. You are advised to conduct your own research before making any investment decisions. Use information provided on this website entirely at your own risk.
Tags: bitcoinbtcPrice actionprice analysis
XRP Price Holds Support – Indicators Show Risk of Downside Break
XRP price is holding gains above the $0.60 zone. The price could gain bearish momentum if there is a close below the $0.570 support zone.
- XRP is facing a major hurdle near the $0.6580 zone.
- The price is now trading below $0.640 and the 100 simple moving average (4 hours).
- There is a key bearish trend line forming with resistance near $0.640 on the 4-hour chart of the XRP/USD pair (data source from Kraken).
- The pair could gain bearish momentum if there is a close below the $0.5720 support.
XRP Price Faces Uphill Task
After a steady decline, XRP price found support near the $0.5720 level. A low was formed at $0.5714 and the price started a fresh increase, like Bitcoin and Ethereum.
There was a move above the $0.5880 and $0.600 resistance levels. The price cleared the 23.6% Fib retracement level of the downward wave from the $0.7442 swing high to the $0.5714 low. The bulls pushed the price above the $0.620 resistance zone, but the bears are active near $0.640.
Ripple’s token price is now trading above $0.6320 and the 100 simple moving average (4 hours). On the upside, immediate resistance is near the $0.640 zone. There is also a key bearish trend line forming with resistance near $0.640 on the 4-hour chart of the XRP/USD pair.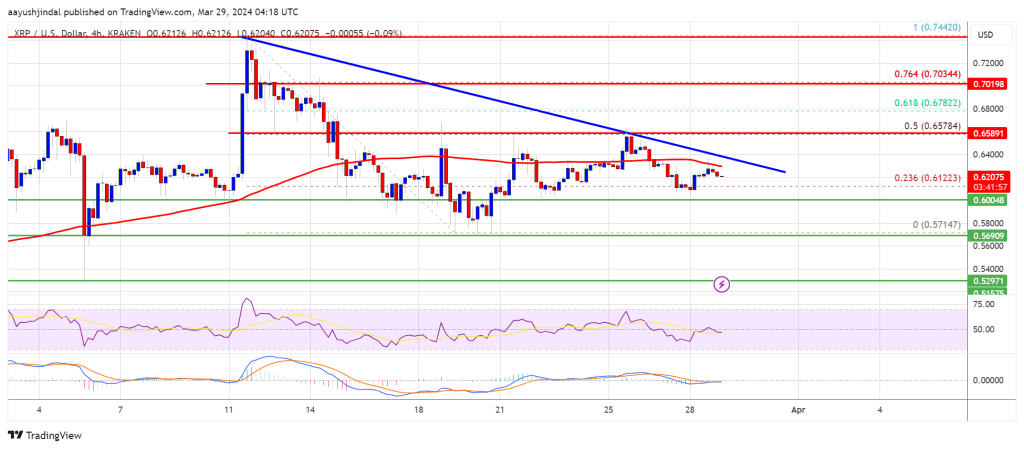 The next key resistance is near $0.6580. It is close to the 50% Fib retracement level of the downward wave from the $0.7442 swing high to the $0.5714 low. A close above the $0.6580 resistance zone could spark a strong increase. The next key resistance is near $0.700. If the bulls remain in action above the $0.700 resistance level, there could be a rally toward the $0.7440 resistance. Any more gains might send the price toward the $0.800 resistance.
More Losses?
If XRP fails to clear the $0.640 resistance zone, it could start another decline. Initial support on the downside is near the $0.600 zone.
The next major support is at $0.5720. If there is a downside break and a close below the $0.5720 level, the price might accelerate lower. In the stated case, the price could retest the $0.5250 support zone.
Technical Indicators
4-Hours MACD – The MACD for XRP/USD is now losing pace in the bullish zone.
4-Hours RSI (Relative Strength Index) – The RSI for XRP/USD is now above the 50 level.
Major Support Levels – $0.600, $0.5720, and $0.5250.
Major Resistance Levels – $0.640, $0.6580, and $0.700.
Disclaimer: The article is provided for educational purposes only. It does not represent the opinions of NewsBTC on whether to buy, sell or hold any investments and naturally investing carries risks. You are advised to conduct your own research before making any investment decisions. Use information provided on this website entirely at your own risk.
Tags: RippleXRPBTCXRPUSDxrpusdt


