$3K, $5K, $10K – Is this the upcoming trajectory of Ethereum?

After weeks of fluctuating trends, Ethereum (ETH) has surpassed the $3,000 threshold. This has sparked speculation within the community about the possibility of ETH entering the two-digit price range. Is this the beginning of such a growth trajectory?
Ethereum breaches $3,000
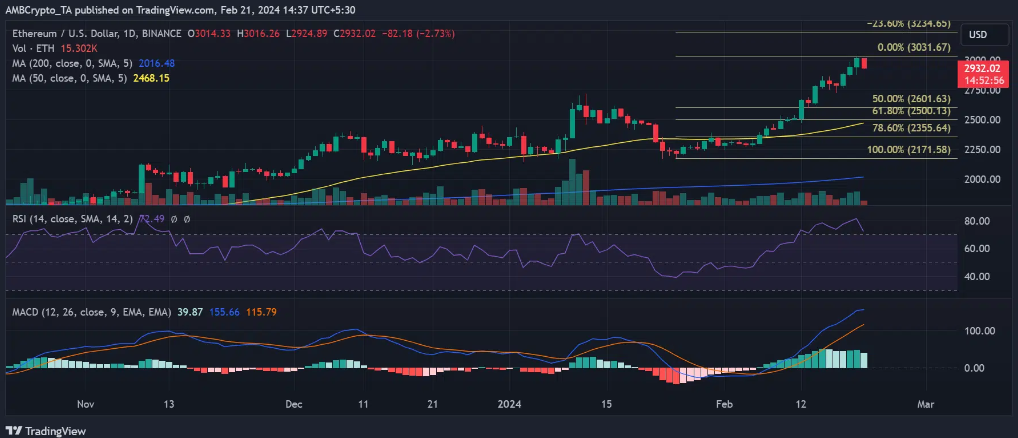
Following three consecutive days of an upward trend, Ethereum surpassed the $3,000 mark on the 20th of February. The daily chart shows a 3.35% increase, closing around $2,880 on the 18th of February, followed by a 2.22% rise on the 19th of February, closing at $2,944.
On the 20th of February, a 2.38% increase pushed the price to around $3,014, reaching a peak above $3,030.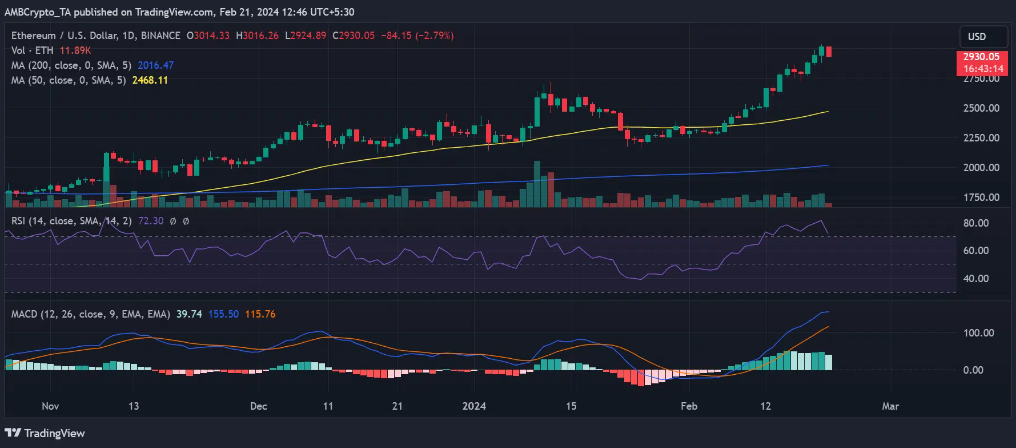
Significantly, this marks the first time since April 2022 that ETH has traded above $3,000, reminiscent of the observed upward trend in 2022 before the market downturn.
At the current moment, ETH has decreased by approximately 2.7%, hovering around $2,950.
Furthermore, the recent price decline corresponds with a drop in the Relative Strength Index (RSI) from the threshold of 80 during the bullish phase to around 73.
Despite the pullback, this indicates that Ethereum is still in an upward trend, albeit in the oversold territory.
Increased Ethereum liquidations to the highest in weeks
The price volatility of Ethereum in the attempt to break through the $3,000 range has led to a surge in liquidation volume on the 20th of February.
Analysis of the liquidation chart on Coinglass shows that both long and short positions experienced a total liquidation volume of over $20 million.
Specifically, long positions witnessed a liquidation volume of $20.56 million, while short positions had a higher liquidation volume at $32.77 million.
The total liquidation on the 20th of February exceeded $53 million, marking the highest level in weeks.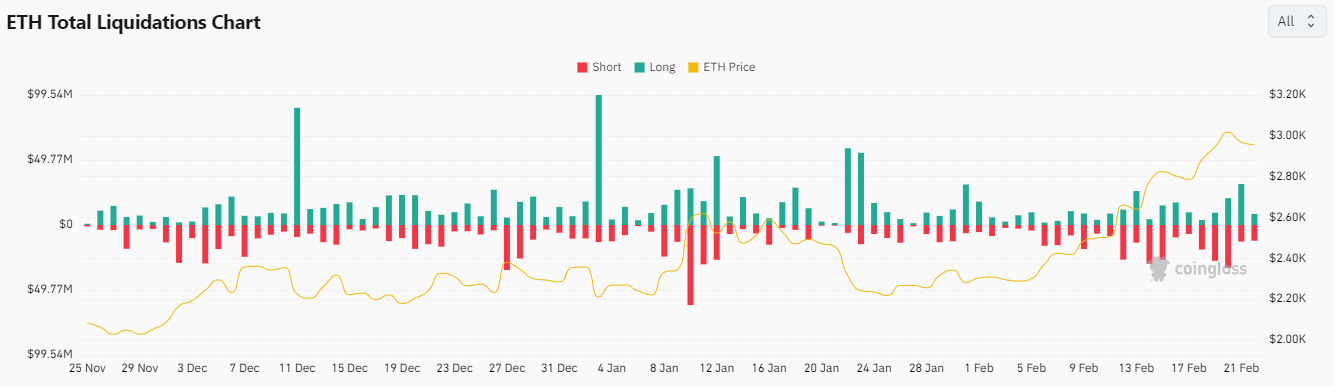
ETH leaves the exchange as sellers take control
Checking the Ethereum volume chart on Santiment reveals that despite the price increase on the 20th of February, there was no significant movement in volume.
By the end of that day, the trading volume stood at around $20.3 billion, lower than the day before when the price was lower. However, at the current moment, the trading volume has increased and reached nearly $21 billion.
While this may suggest the dominance of sellers, analysis of ETH Netflow volume on CryptoQuant provides different signals. At the end of the day on the 20th of February, capital flow was very positive, with nearly 770 ETH transferred into exchanges.
However, at the time of writing, around 25,000 ETH has exited the exchange.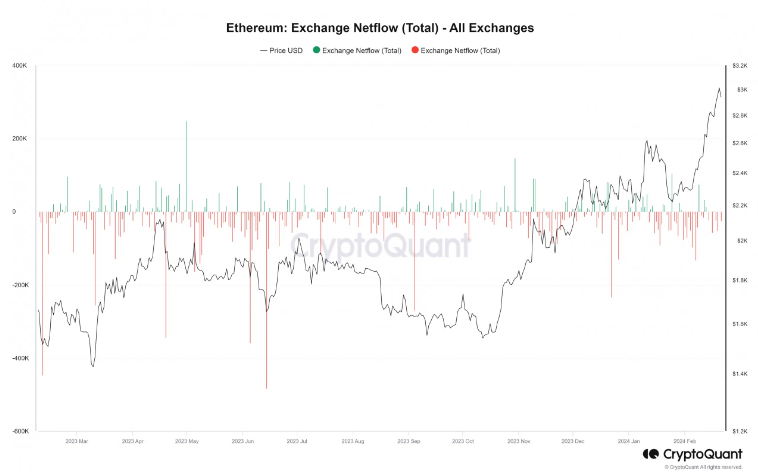
Should we expect a two-digit price?
There is a growing narrative surrounding the potential for Ethereum's price to reach two-digit figures. This story is partly fueled by recent ETF proposals from major institutions such as Blackrock.
The approval of these proposals could lead to additional capital inflows, similar to what happened with Bitcoin. However, it takes time to clearly see the impact of this.
Analysis using Fibonacci retracement levels provides an overview of the potential price based on Ethereum's current peak and trough. The chart indicates that the Fibonacci tool predicts a price range capped at $4,700 with a 200% increase.
This suggests that the journey towards the two-digit range could commence as Ethereum enters the $4,700 - $5,000 price range.