R and Statistics: Introduction to the Journey of Data Science

Data science is a dynamic field that plays a critical role in today's business and research. Professionals in this field specialize in big data clustering, predictive analysis, and extracting insights to support the strategic decisions of companies and organizations. In this article, we will explore the combination of the R programming language and statistical analysis, fundamental pillars of data science.
1. Installation of R and RStudio:
The first step to embark on the journey of data science is to install the R programming language and the RStudio development environment. R is a powerful language designed for statistical calculations and graph plotting, while RStudio is an IDE that allows you to organize and develop your R projects.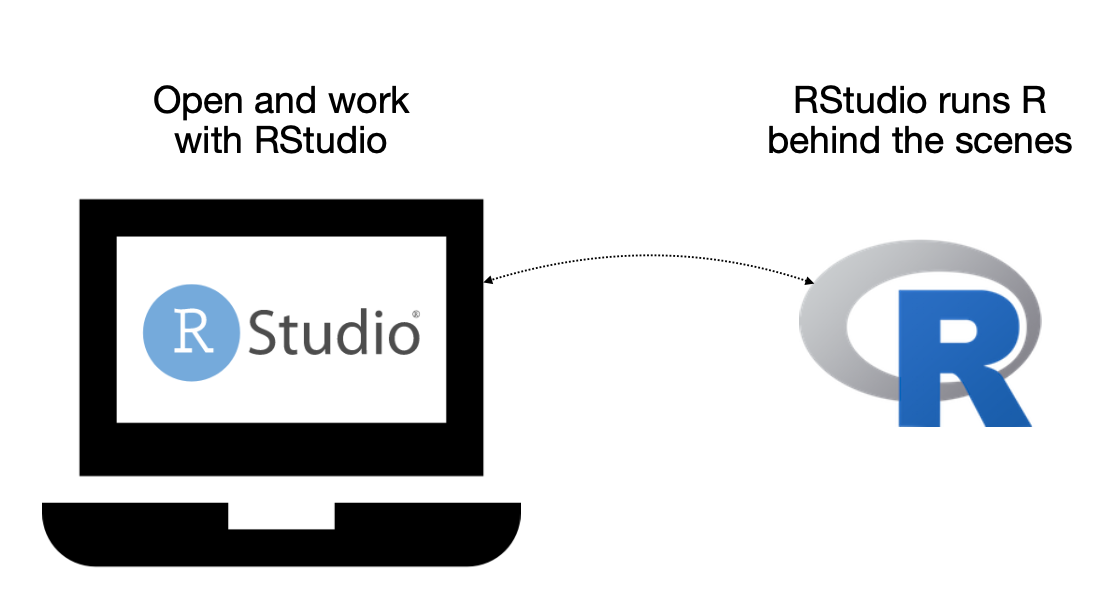
2. Basic R Syntax:
Learning the basic syntax of R, including variables, functions, and fundamental operations, is essential. This helps improve your programming skills.
# Example R code
data <- c(3, 7, 1, 8, 5)
mean_value <- mean(data)
print(mean_value)
3. Data Manipulation:
R has various data structures such as vectors, matrices, data frames, and lists. Manipulate and organize your data using these structures.
# Working with data frames
data_frame <- data.frame(name = c("Ali", "Ayse", "Mehmet"),
                          age = c(25, 30, 22),
                          salary = c(5000, 6000, 4500))
4. Exploratory Data Analysis (EDA):
Exploratory Data Analysis involves techniques to understand your data set. Explore important features in your data using statistical summaries and charts.
# Plotting a histogram
hist(data$age, main = "Age Distribution", xlab = "Age", ylab = "Frequency")
5. Statistical Analysis:
Utilize statistical techniques such as hypothesis testing and regression analysis in R to understand relationships in your data set.
# Independent two-sample t-test
t.test(group1, group2)
6. Machine Learning with R:
R offers various packages to implement machine learning algorithms. Explore supervised and unsupervised learning concepts.
# Classification with decision trees
library(rpart)
model <- rpart(SatisfactionStatus ~ ., data = data, method = "class")
7. Applied Projects:
Reinforce your data science skills by working on practical projects. Participate in Kaggle competitions to enhance your real-world problem-solving skills.
8. Continuous Learning:
As data science is a rapidly evolving field, staying updated is crucial. Join online courses and be active in communities like Stack Overflow. This article emphasizes the pivotal roles of the R programming language and statistical analysis in the journey of data science. Acquiring this foundational familiarity with R and statistics is a significant step toward success in the realms of data analysis and science.
R Programming Language and Big Data
Linear and non-linear modeling, classical statistical tests, time series analysis, classification, clustering, etc. The R programming language, used for graphics as well as statistical calculations, is a software that offers high-level graphics, interfaces with other languages and debugging opportunities, and whose number of users is increasing day by day. The R language is like a derivative of S, designed in the 1980s and widely used in the statistical community ever since.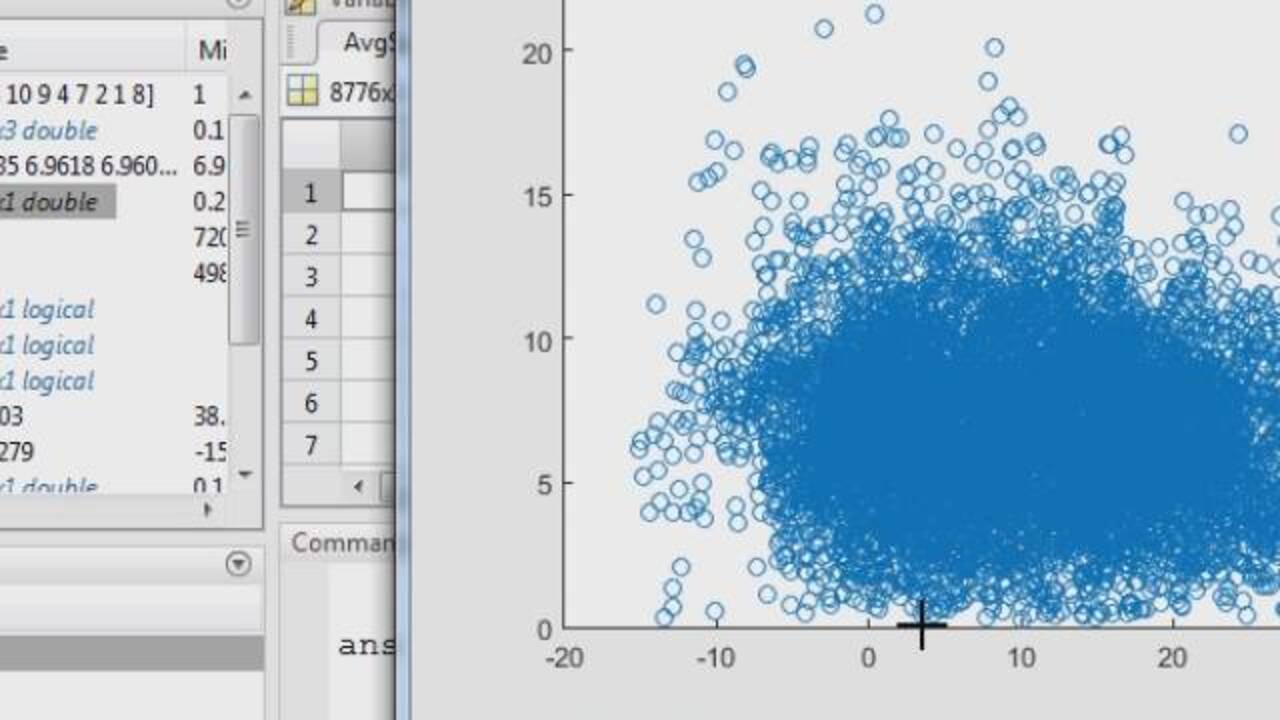
With the development of Big Data Technology, human life is becoming mobile and smart, with more devices being used every day. However, the development of sensor technologies, increased mobility, increased use of social networks and development of communication technologies have also increased the diversity, speed and amount of data produced. As the use of social networks increases day by day, the speed and diversity of data has also increased. Data produced at high speed brings with it the problems of receiving, understanding and processing data at the same speed. The concept of big data includes issues related to high volume and speed of data, but also includes diversity; It also refers to the storage, management and access to information of unstructured or fluid data such as video, audio, text.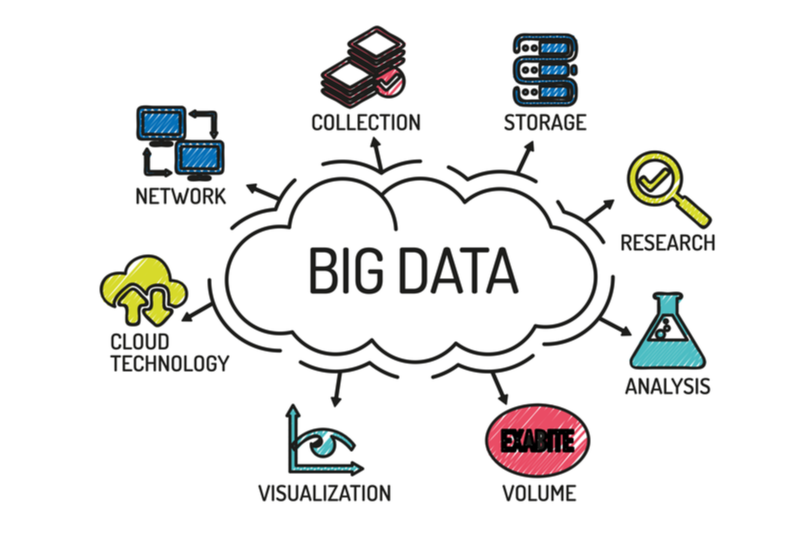
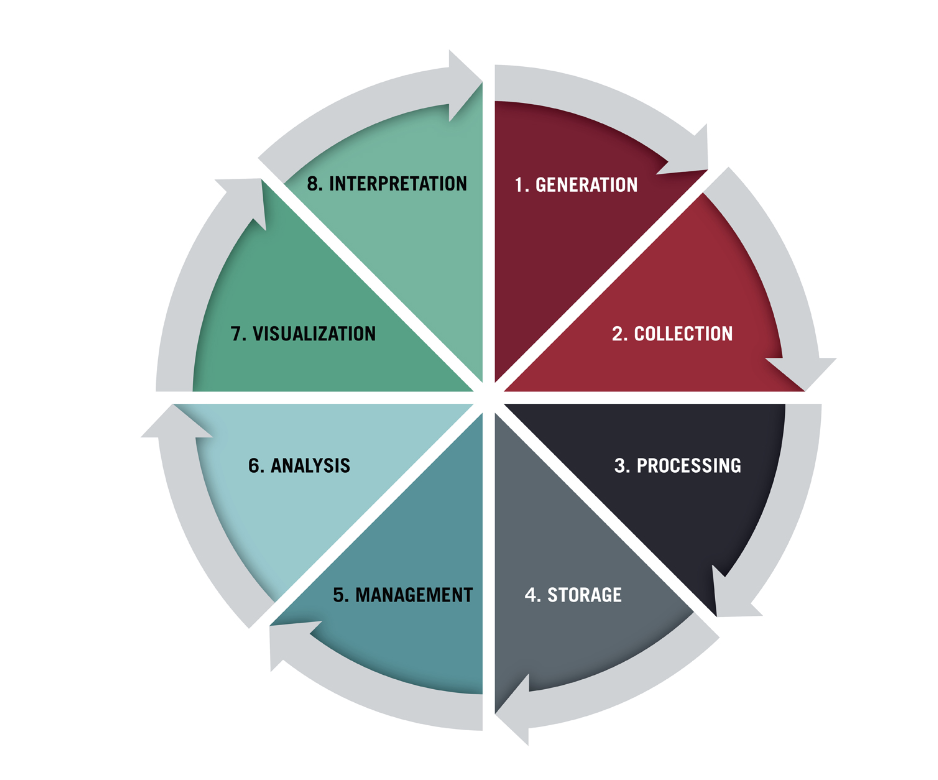
Obtaining Data
Data science has become a critical element in making informed decisions in the information age. However, before these decisions are made, there is a need for first-class data that needs processing and analysis. This is where the data acquisition process comes into play. In this article, we will explore the fundamental step in your data science journey, the data acquisition process.
1. Types and Sources of Data:
The data acquisition process involves understanding what types of data you need initially. Data types are generally classified as structured (e.g., data from databases), semi-structured, or unstructured (e.g., data from text documents). Sources can vary widely, including internal company databases, external APIs, websites, sensor data, etc.
2. Data Collection Methods:
The data collection process involves determining appropriate methods based on the chosen data types and sources. Various methods such as surveys, observations, experimental studies, web scraping, API calls, etc., can be employed. Each method has its advantages and disadvantages, so the choice of method should be made carefully.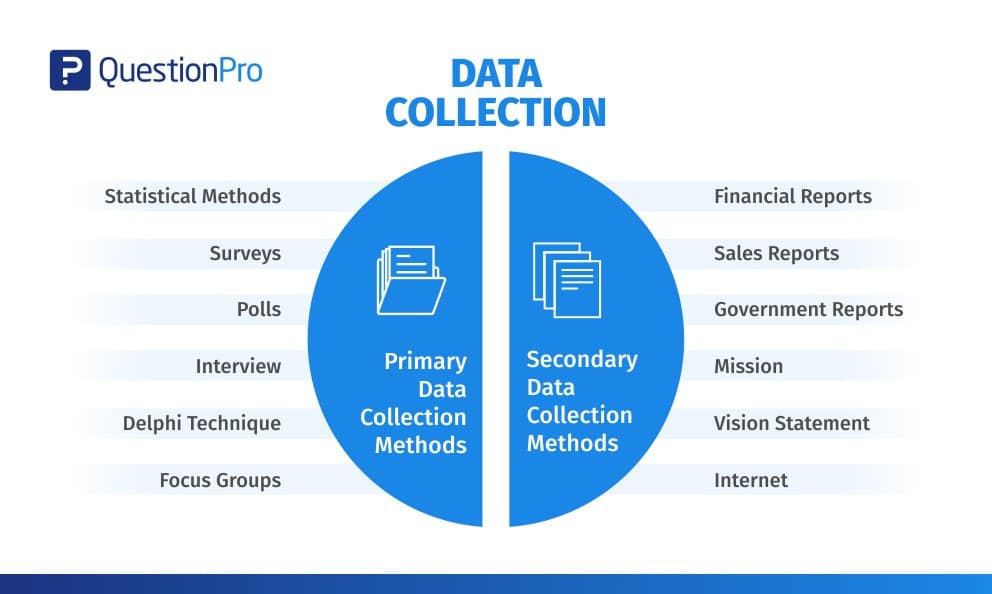
3. Stages of Data Collection:
The data collection process typically consists of the following stages:
- Planning: Determine what data you need and plan the data collection process.
- Collection: Gather data from identified sources, emphasizing accuracy and reliability.
- Cleaning: Check collected data, correct missing or erroneous data, and address inconsistencies.
- Storage: Safely store the data, often in a data repository.
4. Ethical and Legal Considerations:
It is crucial to pay attention to ethical and legal considerations during the data collection process. Ensuring compliance with legal regulations, especially regarding the protection of personal data, is essential. Additionally, clearly specify the purposes for which you will use the collected data.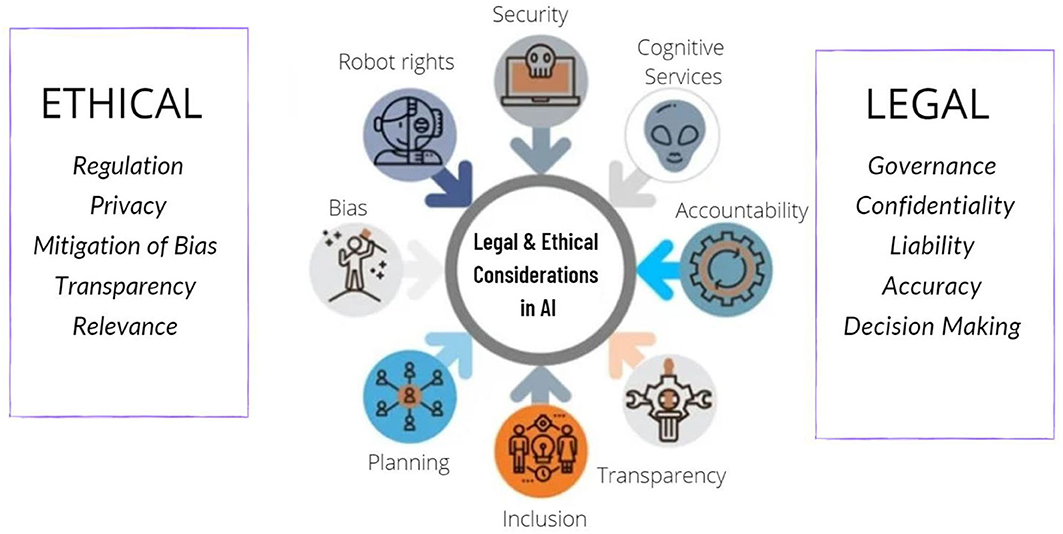
5. Automation and Data Quality:
Automating the data collection process can enhance data quality. Automated collection processes can reduce data errors and make the process more efficient. However, caution should be exercised against potential errors introduced by automation.
6. Preparation for Data Analytics:
To analyze the collected data effectively, it is important to clean and format datasets before transferring them to analysis tools (e.g., R or Python). This step will assist in more efficient analysis for your data science projects. At the beginning of your data science journey, gaining access to accurate and reliable data is a critical step. By following these fundamental steps in the data acquisition process, you can build a strong foundation for your data science projects and take your first step toward success.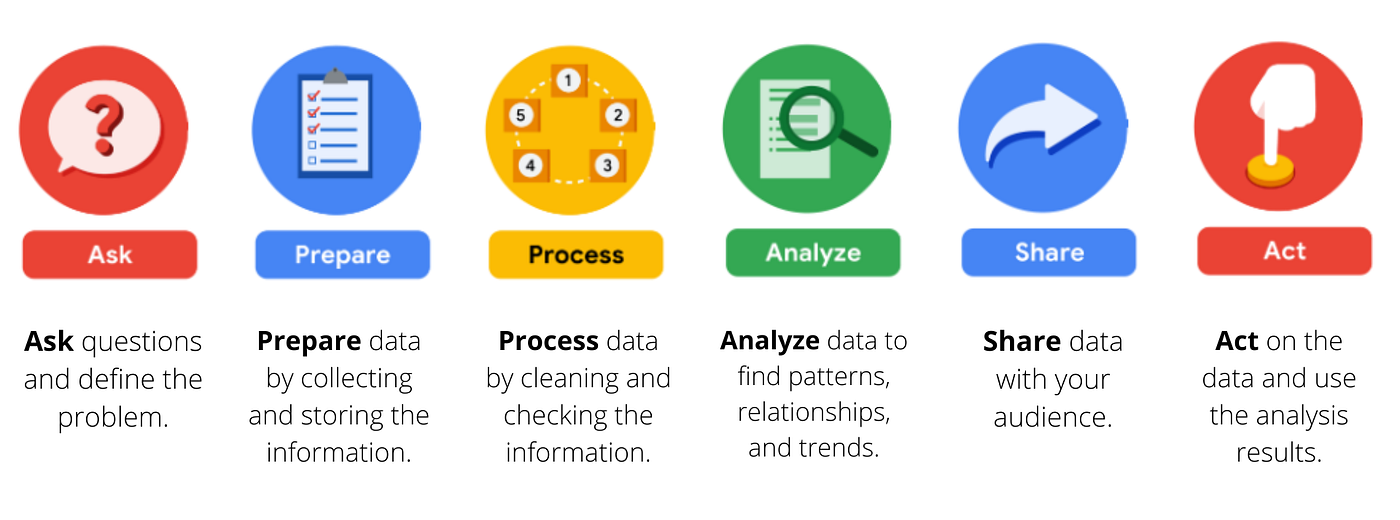
Results
Various tools will be needed for social media analysis in the future, as it is today. Since the data produced is constantly increasing, analysis tools also need to improve themselves. R programming language, which has been making effective analyzes with the increasing number of users lately, is one of them. This study is an example of social media analysis with the R programming language. Researchers considering working in this field will be able to achieve different results by using the capabilities of the text mining library, especially on Twitter.