XRP Braces for Breakout or Breakdown as Crucial Chart Pattern Looms

XRP, the sixth-largest cryptocurrency by market capitalization, is approaching a decisive moment as a major chart pattern looms.
XRP's daily simple moving averages (SMA) are deemed to make a crossing in the next few days, resulting in either a golden or death cross.
The cryptocurrency's daily 50-day SMA seems to be on track to drop below its 200-day SMA, which might result in a bearish death cross unless invalidated.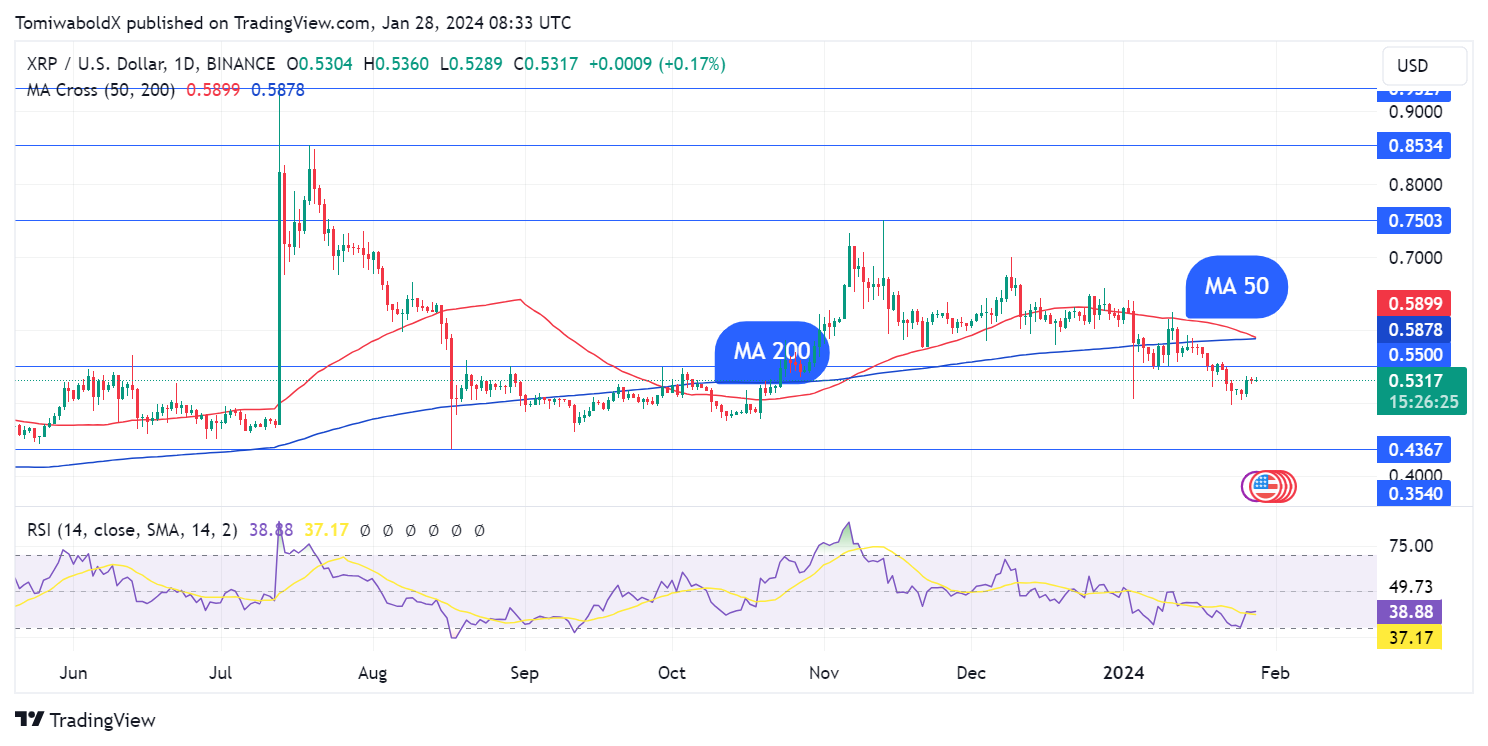 In another scenario, the 50-day SMA could top the 200-day SMA, resulting in a golden crossover. However, the nature of the SMA crossing may indicate whether it is a death cross or a golden cross.
XRP has been struggling to recover from the recent market crash that saw it drop to a three-month low of $0.496 on Jan. 23. The price has since bounced back to around $0.56, but it remains below the key resistance levels of the 50-day SMA ($0.589) and the 200-day SMA ($0.587).
Still, history shows that a moving average crossover might be unreliable as a standalone indicator. XRP death crosses have often marked major or intermediate bottoms for the cryptocurrency in the past.
XRP bottomed at lows of $0.483 shortly after the formation of a death cross on its charts last September and went ahead to reach highs of $0.75 in November, less than two months later.
Likely scenarios
In the event of a death cross, a possible scenario could be that XRP might briefly decline, except if a bottom is already reached before it resumes an upward movement.
If this scenario plays out, XRP could target the next resistance levels at $0.70 and $0.75 if a breach of the moving averages is achieved. A break above $0.75 would confirm a bullish reversal and open the door for a rally toward the $1 mark.
On the other hand, if the emergence of a death cross triggers a further wave of selling for the XRP price, the next support levels to watch are $0.483 and $0.476, which have acted as strong demand zones of late. A break below $0.40 would confirm a bearish trend and expose the price to the $0.42 level, which has not been tested since August 2023.
As previously said, moving average crossovers might be unreliable as standalone indicators to depict price movements; hence, traders might as well pay attention to the overall market sentiment and that of the XRPL ecosystem.