Bitcoin Investors In The Red: Losses Trump Profits As Ratio Dips Below 1

Investors are bracing themselves for a rollercoaster ride as Bitcoin, the flagship digital asset, navigates through choppy waters. Recent data from Glassnode has revealed a noteworthy development: the Realized Profit/Loss Ratio for Bitcoin has dipped below one.
Related Reading: Bitcoin Below $70,000: Is $80K Still Possible, Or Is The Rally Over?
This crucial metric, which compares the sell value of Bitcoin with the price at which it was bought, indicates that investors are currently realizing more losses than profits. Historically, such a dip has often heralded a potential bottoming out of Bitcoin’s price, serving as a vital signal for market watchers.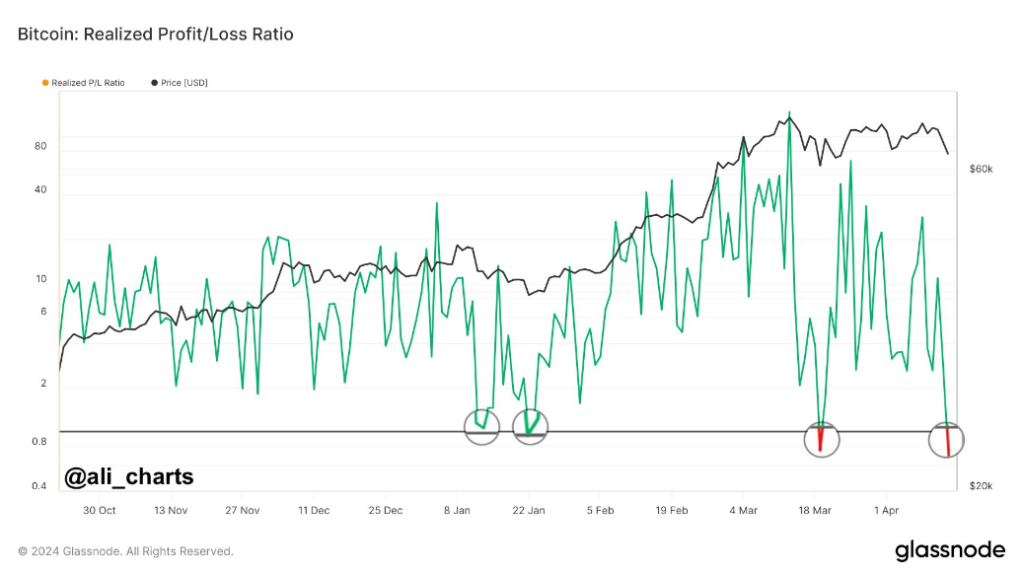
Sense Of Optimism Despite Bitcoin Price Decline
The past 24 hours have witnessed significant volatility in Bitcoin’s price trajectory. A sharp decline early in the day saw Bitcoin’s price plummet to approximately $64,000, worrying many investors.
However, a remarkable recovery ensued, with the price steadily climbing and peaking at around $66,000. This robust rebound has instilled a sense of optimism, with a prevailing bullish sentiment taking hold as the day progressed.
Total crypto market cap currently at $2.261 trillion. Chart: TradingView
Institutional interest in Bitcoin continues to grow, with recent developments signaling potential shifts in capital inflows. The approval of a spot Bitcoin ETF by Hong Kong regulators has opened the floodgates for increased institutional engagement, particularly from Asia.
This move could inject fresh capital into Bitcoin markets, potentially fueling further price momentum. Furthermore, regional dynamics play a significant role in shaping investor sentiment and behavior. Varying investment trends across different regions highlight the diverse responses to prevailing market conditions.
While some regions may exhibit cautious sentiment amidst volatility and geopolitical uncertainties, others may embrace Bitcoin as a hedge against inflation and currency devaluation.
Critical Support Levels
Bitcoin analyst Willy Woo has pinpointed a critical support level at $59,000. Breaching this threshold could signify a transition into a bearish market sentiment. Conversely, there’s anticipation among investors for potential short liquidations that could drive the price upwards, potentially reaching between $70,000 and $75,000, provided that current support levels hold steady.
These anticipated events hinge on market liquidity and investor reactions to the rapidly evolving price movements. As Bitcoin continues its consolidation phase near all-time highs, investors remain cautiously optimistic about its future prospects.
The upcoming halving event adds another layer of complexity to the already intricate market dynamics, with expectations of heightened volatility in the days ahead.
Related Reading: Bitcoin Bonanza Before The Halving? Analyst Sees Pre-Crash Buying Window
Analysts suggest that this period of lateral movement serves as a crucial stage for the redistribution of assets among investors, potentially laying the groundwork for a more sustainable recovery in the long run.
The cryptocurrency market, particularly Bitcoin, is navigating through a period of heightened uncertainty and volatility. The recent dip in the Realized Profit/Loss Ratio signals a potential turning point in Bitcoin’s price trajectory, while institutional interest and regional dynamics continue to shape market sentiment.
Featured image from Pexels, chart from TradingView![]()
Disclaimer: The article is provided for educational purposes only. It does not represent the opinions of NewsBTC on whether to buy, sell or hold any investments and naturally investing carries risks. You are advised to conduct your own research before making any investment decisions. Use information provided on this website entirely at your own risk.
Tags: bitcoinbtccryptoPrice actionprice analysis
Why The Bitcoin Halving Matters, But Not The Way You Think: Expert
David Lawant, Head of Research at FalconX, a digital assets prime brokerage with trading, financing, and custody for leading financial institutions, recently offered an analysis on X (formerly Twitter) regarding the evolving role of Bitcoin halvings in market dynamics. This analysis challenges the traditional view that halvings directly and significantly affect Bitcoin’s price, instead highlighting a broader economic and strategic context that might be influencing investor perceptions and market behavior more profoundly.
The Miner’s Diminishing Impact On Bitcoin Price
Lawant begins by addressing the changing impact of Bitcoin miners on market prices. He presents a detailed chart comparing the total mining revenue to the Bitcoin spot traded volume from 2012 onwards, clearly marking the dates of the three previous halvings. This data reveals a significant shift: “The most crucial chart for comprehending halving dynamics is the one below, not the price chart. It illustrates the proportion of total mining revenue compared to BTC spot traded volume since 2012, with the three halving dates marked.”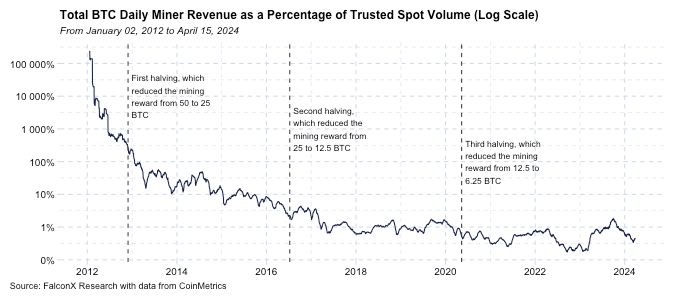 Bitcoin Halving effects over time | Source: X @dlawant
In 2012, total mining revenue was multiples of the daily traded volume, highlighting a time when miners’ decisions to sell could have significant impacts on the market. By 2016, this figure was still a notable double-digit percentage of daily volume but has since declined. Lawant emphasizes, “While miners remain integral to the Bitcoin ecosystem, their influence on price formation has notably waned.”![]()
Related Reading: Bitcoin Readying For A 12-Year Bull Run To $650,000 If Bulls Take Charge: Analyst
He elaborates that this reduction is partly due to the increasing diversification of Bitcoin holders and the growing sophistication of financial instruments within the cryptocurrency market. Furthermore, not all mining revenue is immediately impacted by halving events—miners may choose to hold onto their rewards rather than sell, affecting the direct impact of reduced block rewards on supply.
Lawant connects the timing of halvings to broader economic cycles, proposing that halvings do not occur in isolation but alongside significant monetary policy shifts. This juxtaposition increases the narrative impact of halvings, as they underscore Bitcoin’s attributes of scarcity and decentralization during periods when traditional monetary systems are under stress.
“Bitcoin halving events tend to occur during critical monetary policy turning points, so the narrative fit is just too perfect to assume they cannot influence prices,” Lawant observes. This statement suggests a psychological and strategic dimension where the perceived value of Bitcoin’s scarcity becomes more pronounced.
Related Reading: Bitcoin Whales Showing Different Behavior From Past Cycles, But Why?
The analysis then shifts towards the macroeconomic environment influencing Bitcoin’s appeal. Lawant references the 2020 discussion by investor Paul Tudor Jones who labeled the economic climate as “The Great Monetary Inflation,” a period marked by aggressive monetary expansion by central banks. Lawant argues, “I’d argue that this was a more important factor in the 2020-2021 bull run than the direct flow impact from the halving,” pointing out that macroeconomic factors may have had a more substantial influence on Bitcoin’s price than the halving itself.
Future Prospects: Macroeconomics Over Mechanics
Looking towards the future, Lawant speculates that as the world enters a new phase of economic uncertainty and potential monetary reform, macroeconomic factors will increasingly dictate Bitcoin’s price movements rather than the mechanical aspects of halvings.
“Now in 2024, the concerns center around the aftermath of the fiscal/monetary policies that have been in place for decades but are getting turbocharged in a world that is very different from four years ago. […] We are potentially entering a new leg of this macroeconomic cycle, and macro is becoming a more critical factor in BTC price action,” he concludes.
This perspective suggests that while the direct price impact of Bitcoin halvings may diminish, the broader economic context will likely highlight Bitcoin’s fundamental properties—immutability and a fixed supply cap—as crucial anchors for its value proposition in a rapidly evolving economic landscape.
At press time, BTC traded at $62,873.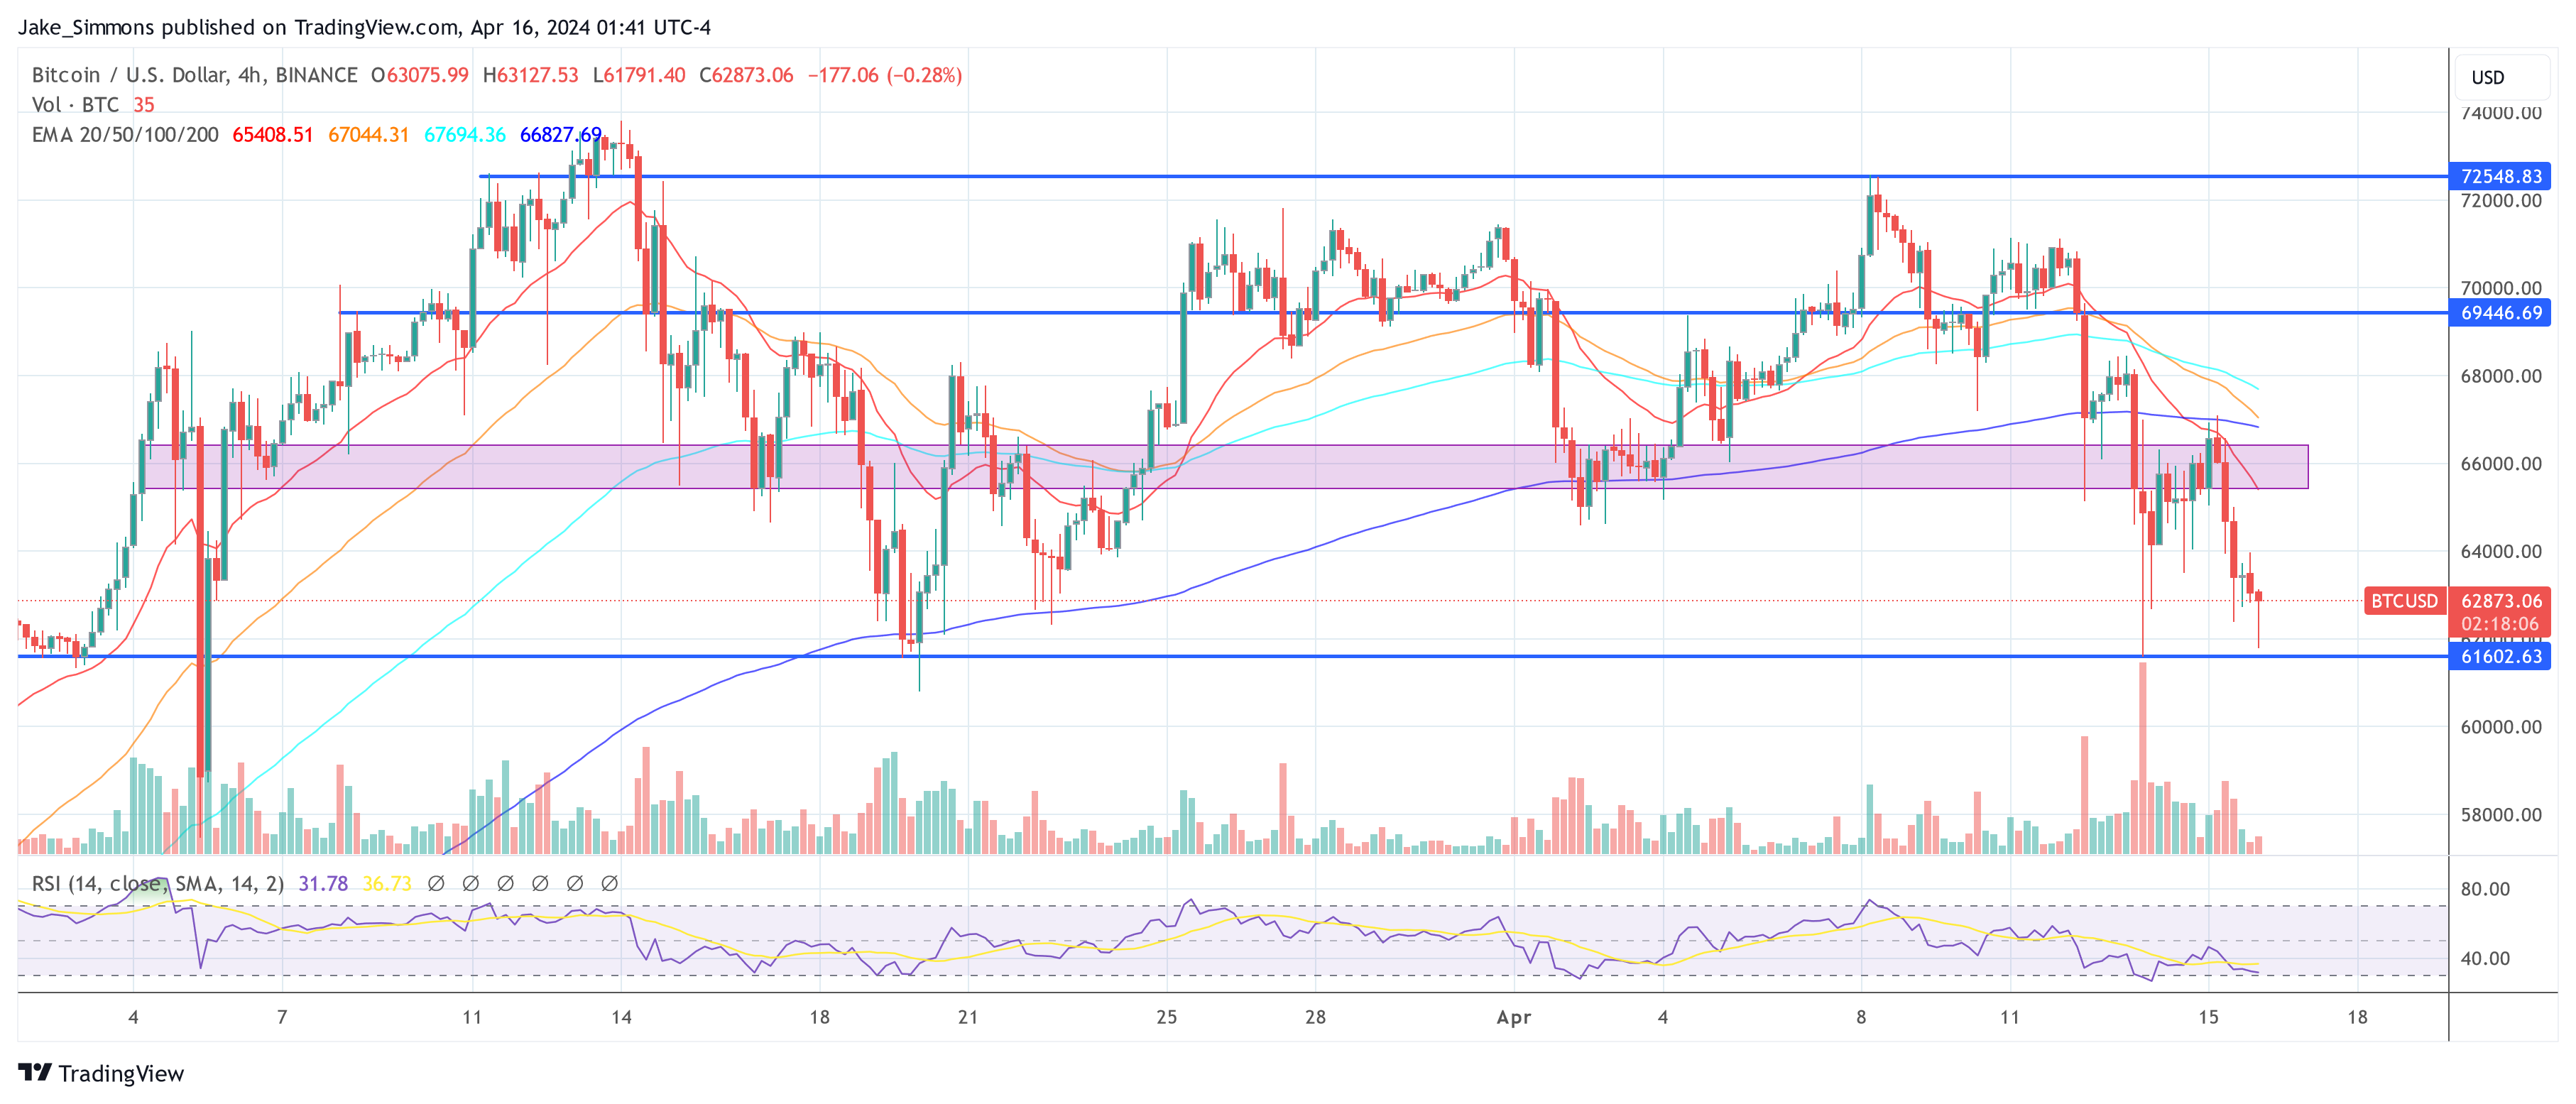 BTC price, 4-hour chart | Source: BTCUSD on TradingView.com
Featured image created with DALL·E, chart from TradingView.com
Disclaimer: The article is provided for educational purposes only. It does not represent the opinions of NewsBTC on whether to buy, sell or hold any investments and naturally investing carries risks. You are advised to conduct your own research before making any investment decisions. Use information provided on this website entirely at your own risk.
Tags: bitcoinBitcoin HalvingBitcoin newsbitcoin pricebtc
DOGE Price Prediction – Dogecoin Could Restart Drop To $0.12

Dogecoin is struggling below the $0.180 resistance zone against the US Dollar. DOGE must stay above the $0.1450 support zone to start a fresh increase.
- DOGE started a fresh decline below the $0.1750 zone against the US dollar.
- The price is trading above the $0.1700 level and the 100 simple moving average (4 hours).
- There is a key contracting forming with support at $0.1540 on the 4-hour chart of the DOGE/USD pair (data source from Kraken).
- The price could restart its increase unless there is a close below the $0.1450 support.
Dogecoin Price Turns Red
After struggling to clear the $0.20 resistance zone, Dogecoin price started a fresh decline. There was a sharp bearish move below the $0.180 and $0.1650 levels. DOGE traded as low as $0.1283 and recently attempted a recovery wave like Bitcoin and Ethereum.
The price climbed above the $0.1450 level. It broke the 23.6% Fib retracement level of the downward move from the $0.2096 swing high to the $0.1283 low.![]() However, the bears are active near the $0.1680 resistance and the 50% Fib retracement level of the downward move from the $0.2096 swing high to the $0.1283 low. The price is now consolidating near the $0.1550 level. There is also a key contracting forming with support at $0.1540 on the 4-hour chart of the DOGE/USD pair.
However, the bears are active near the $0.1680 resistance and the 50% Fib retracement level of the downward move from the $0.2096 swing high to the $0.1283 low. The price is now consolidating near the $0.1550 level. There is also a key contracting forming with support at $0.1540 on the 4-hour chart of the DOGE/USD pair.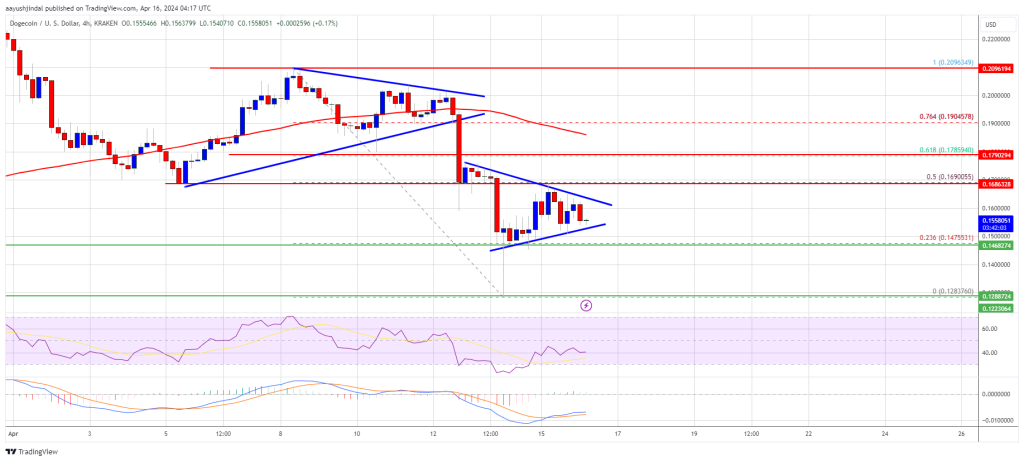 Source: DOGEUSD on TradingView.com
Dogecoin is also below the $0.1600 level and the 100 simple moving average (4 hours). On the upside, the price is facing resistance near the $0.160 level. The next major resistance is near the $0.170 level. A close above the $0.170 resistance might send the price toward the $0.1880 resistance. The next major resistance is near $0.200. Any more gains might send the price toward the $0.220 level.
More Downsides in DOGE?
If DOGE’s price fails to gain pace above the $0.160 level, it could continue to move down. Initial support on the downside is near the $0.1520 level.
The next major support is near the $0.1450 level. If there is a downside break below the $0.1450 support, the price could decline further. In the stated case, the price might decline toward the $0.120 level.
Technical Indicators
4 Hours MACD – The MACD for DOGE/USD is now gaining momentum in the bearish zone.
4 Hours RSI (Relative Strength Index) – The RSI for DOGE/USD is now below the 50 level.
Major Support Levels – $0.1520, $0.1450 and $0.1280.
Major Resistance Levels – $0.1600, $0.1780, and $0.200.
Disclaimer: The article is provided for educational purposes only. It does not represent the opinions of NewsBTC on whether to buy, sell or hold any investments and naturally investing carries risks. You are advised to conduct your own research before making any investment decisions. Use information provided on this website entirely at your own risk.
Ethereum Price Recovery In Jeopardy? Decoding Key Hurdles To Fresh Increase
Ethereum price is facing many hurdles near $3,200. ETH could gain bearish momentum if the price stays below $3,200 and $3,280.
- Ethereum is struggling to recover above the $3,200 resistance zone.
- The price is trading below $3,200 and the 100-hourly Simple Moving Average.
- There was a break below a connecting bullish trend line with support at $3,100 on the hourly chart of ETH/USD (data feed via Kraken).
- The pair could start another decline if there is a close below the $3,000 support zone.
Ethereum Price Faces Hurdles
Ethereum price started a recovery wave above the $3,000 resistance zone. ETH was able to climb above the $3,120 level. However, the bears were active near the $3,280 resistance zone.
A high was formed at $3,278 and the price started a fresh decline, like Bitcoin. There was a move below the $3,200 support zone. The price declined below the 23.6% Fib retracement level of the recovery wave from the $2,537 swing low to the $3,278 high.![]()
There was also a break below a connecting bullish trend line with support at $3,100 on the hourly chart of ETH/USD. Ethereum is now trading below $3,200 and the 100-hourly Simple Moving Average.
Immediate resistance is near the $3,200 level. The first major resistance is near the $3,250 level. The next key resistance sits at $3,280, above which the price might test the $3,350 level. The key hurdle could be $3,500, above which Ether could gain bullish momentum.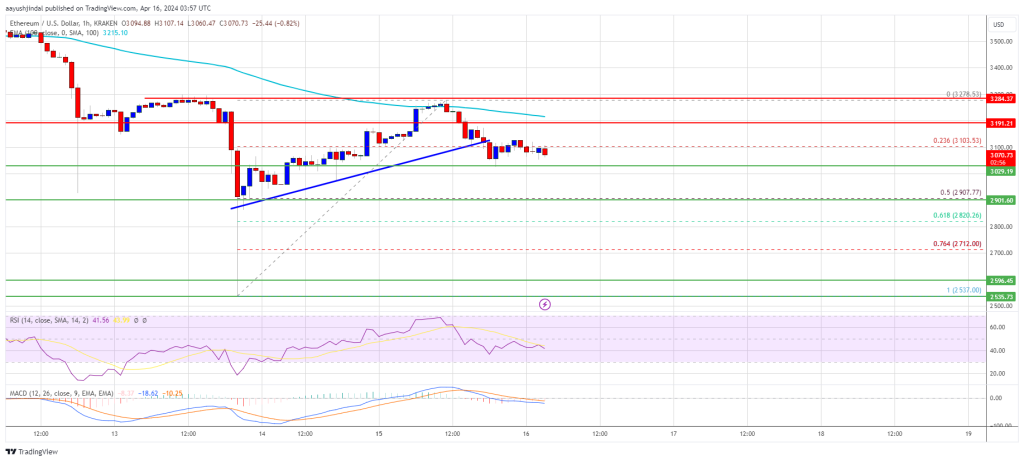
Source: ETHUSD on TradingView.com
In the stated case, the price could rise toward the $3,620 zone. If there is a move above the $3,620 resistance, Ethereum could even rise toward the $3,750 resistance.
More Losses In ETH?
If Ethereum fails to clear the $3,200 resistance, it could continue to move down. Initial support on the downside is near the $3,000 level.
The first major support is near the $2,900 zone or the 50% Fib retracement level of the recovery wave from the $2,537 swing low to the $3,278 high. The next key support could be the $2,820 zone. A clear move below the $2,820 support might send the price toward $2,650. Any more losses might send the price toward the $2,550 level.
Technical Indicators
Hourly MACD – The MACD for ETH/USD is gaining momentum in the bearish zone.
Hourly RSI – The RSI for ETH/USD is now below the 50 level.
Major Support Level – $3,000
Major Resistance Level – $3,200
Disclaimer: The article is provided for educational purposes only. It does not represent the opinions of NewsBTC on whether to buy, sell or hold any investments and naturally investing carries risks. You are advised to conduct your own research before making any investment decisions. Use information provided on this website entirely at your own risk.
Bitcoin Bears Beware: $3 Billion Short Liquidation Looms At This Price Mark, Warns Analyst
The Bitcoin market is currently on edge as prominent analyst Crypto Rover warns of a potential liquidation event that could negatively affect the short holders.
With Bitcoin trading within a significant consolidation phase, as revealed by Rover, analysis suggests that over $3 billion in short positions could face liquidation should Bitcoin climb back to a specific price mark.
Related Reading: Bitcoin Bonanza Before The Halving? Analyst Sees Pre-Crash Buying Window
Bitcoin Bears Beware Of This Price Range
According to Rover, the crucial price mark, which is the $71,600 region, is where the $3 billion short liquidation would occur if Bitcoin reclaims it. Rover’s assessment is based on data gathered from CoinGlass, a renowned derivative market tracker, indicating a substantial liquidity accumulation at higher price levels.![]()
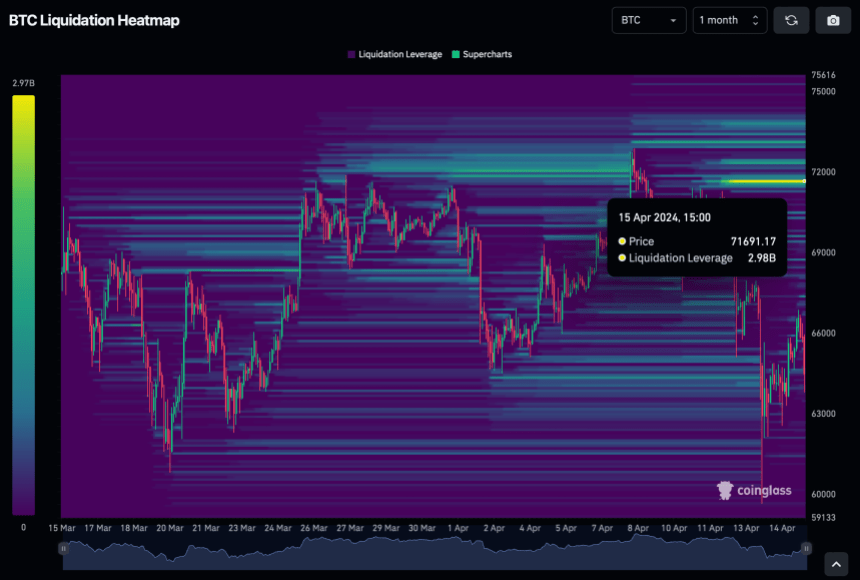 BTC Liquidation Heatmap. | Source: Coinglass
The recent warning from Crypto Rover comes amidst a period of turbulence in the crypto market, marked by sharp price movements and heightened trading activity.
Particularly, Bitcoin experienced a sudden decline over the weekend, bringing its price to as low as $62,000 in the zone. However, in the early hours of Monday, the asset showed signs of recovery, briefly reaching a high of $66,797 before retracing to its current price of $64,711.BTC price is moving sideways on the 4-hour chart. Source: BTC/USDT on TradingView.com
The market downturn over the weekend witnessed a record number of liquidations, with over $1.2 billion in Bitcoin long positions liquidated in a single day, according to WhaleWire.
JUST IN: Over $1.2 Billion in #Bitcoin longs have been liquidated over the last 24 hours, amid market decline, setting a new record. The previous record was $879M.
Today, more Bitcoin bulls have been liquidated than on any day in the last 15 years.
Another reason why buying up… pic.twitter.com/itnwb7rj1d
— WhaleWire (@WhaleWire) April 13, 2024
The liquidation hasn’t stopped, as the latest data from Coinglass reveals that in the past 24 hours alone, 89,151 traders have been liquidated, resulting in a total loss of $266.10 million.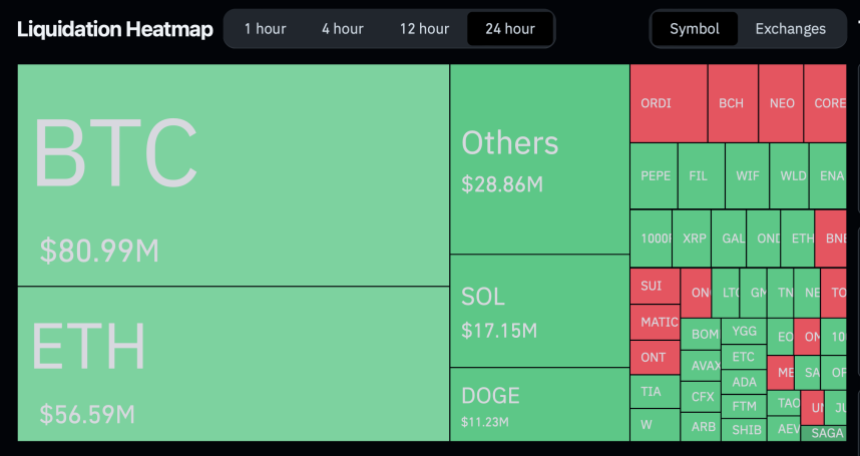 The crypto market liquidation heat map. Source: Coinglass
Analyst Insights And Market Dynamics
It is worth noting that Bitcoin’s recorded slight recovery comes as Hong Kong regulators granted provisional approval for asset managers to launch spot Bitcoin and Ethereum exchange-traded funds (ETFs).
Crypto analyst Willy Woo has shared his perspective on the potential impact of Bitcoin exchange-traded funds (ETFs) on market dynamics.
According to Woo, introducing the new Bitcoin ETFs could lead to significant price targets, with projections ranging from $91,000 at the bear market bottom to $650,000 at the bull market top.
The new #Bitcoin ETFs brings price targets of $91k at the bear market bottom and $650k at the bull market top once ETF investors have fully deployed according to asset manager recommendations***.
These are very conservative numbers. #Bitcoin will beat gold cap when ETFs have…
— Willy Woo (@woonomic) April 15, 2024
Woo’s analysis underscores the growing institutional interest in BTC, with asset managers expected to allocate a substantial portion of their funds to the cryptocurrency.
Related Reading: The Ultra Wealthy Are Investing Big Time In Bitcoin, Barbara Goldstein Reveals
However, Woo emphasizes that these projections are conservative estimates, and Bitcoin’s market capitalization could exceed gold as more capital is deployed into the asset.
Featured image from Unsplash, Chart from TradingView
Disclaimer: The article is provided for educational purposes only. It does not represent the opinions of NewsBTC on whether to buy, sell or hold any investments and naturally investing carries risks. You are advised to conduct your own research before making any investment decisions. Use information provided on this website entirely at your own risk.
Tags: bitcoinBitcoin bearsbitcoin bullsbitcoin marketbitcoin prediction