SuperTrend Indicator Explained: A Beginner's Guide to Trend-Following Without Guesswork
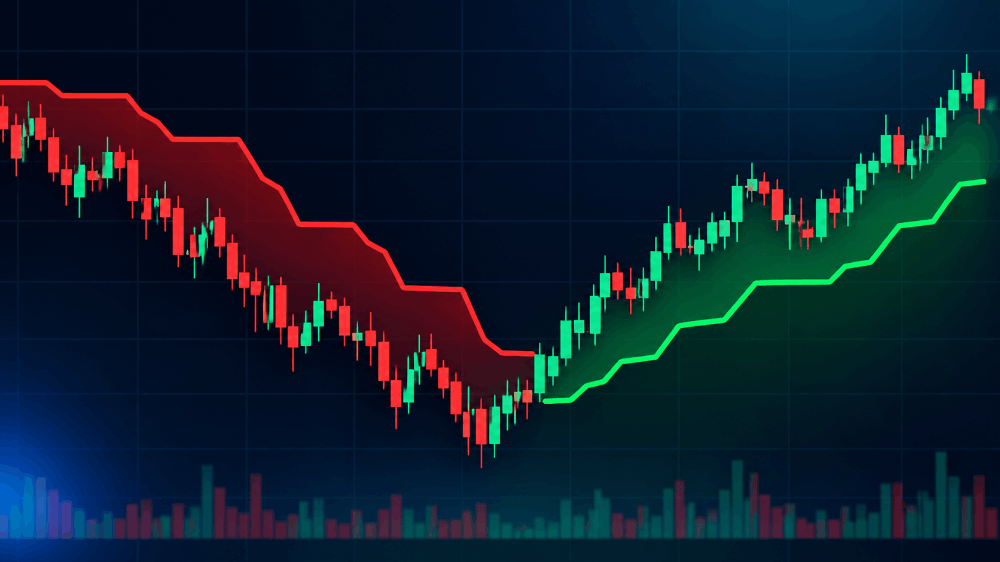
If you've looked at a trading chart with a green or red line hugging the candles and flipping color at turning points, you've probably seen the SuperTrend indicator. It's one of the most popular trend-following tools on TradingView, mostly because it's visually simple — green means the trend is up, red means it's down. No complicated reading required.
But that simplicity hides a few things beginners often get wrong. This guide goes through what SuperTrend actually measures, how its two settings interact, why default values rarely fit your actual chart, where it quietly falls apart, and how to combine it with other tools so you're not relying on it alone.
What SuperTrend Actually Measures
SuperTrend is built on top of a volatility measurement called ATR (Average True Range), which tells you how much a market typically moves over a given period. SuperTrend takes that volatility number, multiplies it by a factor, and plots a band above or below price.
When price closes above the band, the indicator flips to an uptrend (usually shown in green). When price closes below it, it flips to a downtrend (usually red). That's the entire mechanic — it's really a dynamic stop-loss line dressed up as a trend indicator.
This matters because it explains both its strength and its weakness:
- Strength: It automatically adjusts to volatility. In a calmer market the band sits closer to price; in a wild market it widens out, which helps avoid getting flipped by normal noise.
- Weakness: It only works well when there's an actual trend to follow. In a sideways, choppy market, price keeps crossing back and forth over the band, generating one false flip after another.
The Math Behind the Band, in Plain English
You don't need to calculate SuperTrend by hand — the platform does it — but understanding the logic helps you reason about why it behaves the way it does on your chart.
- Calculate ATR over the chosen lookback period (how much the market has typically moved, candle to candle, recently).
- Multiply that ATR value by the chosen multiplier to get a distance.
- Plot an "upper band" at the midpoint price plus that distance, and a "lower band" at the midpoint price minus that distance.
- Track which band price is currently respecting. If price is above the lower band, the trend is up and that lower band becomes the active line, trailing upward as price rises (never moving down while the trend holds). If price closes below it, the trend flips down and the upper band becomes the new active line, trailing downward.
This "ratchet" behavior — the active line only moving in the direction that favors the current trend, never retreating against it mid-trend — is what makes SuperTrend function as a trailing stop as much as a trend signal. It's the same logic professional traders use manually when they move a stop-loss up behind a winning long position but never move it down.
The Two Settings That Control Everything
SuperTrend has just two inputs, and almost all the behavior you see on a chart comes down to these:
- ATR Period — how many candles the volatility calculation looks back over. A shorter period reacts faster but gets noisier. A longer period is smoother but slower to react.
- Multiplier — how far the band sits from price, as a multiple of ATR. A smaller multiplier keeps the band tight, catching trends earlier but flipping more often. A larger multiplier keeps it wider, missing some early moves but filtering out more fake signals.
There's a direct trade-off here: tighten the settings and you catch trends sooner but get burned by more false flips. Loosen the settings and you get fewer false flips but enter trends later and give back more profit before an exit signal fires.
This is why there's no single "correct" setting — it depends on the timeframe you're trading and how much noise you're willing to tolerate in exchange for faster signals.
How the Two Settings Interact
It helps to think of ATR Period and Multiplier as two separate dials controlling different things, rather than one combined "sensitivity" knob:
- ATR Period controls how quickly the volatility estimate itself updates. A period of 7 reacts to a sudden volatility spike within about a week of daily candles; a period of 21 takes roughly three weeks to fully reflect the same spike. Neither is "wrong" — a shorter period makes the band more responsive to a fresh volatility regime; a longer period makes the band more stable but slower to recognize that conditions have changed.
- Multiplier controls how far the band sits from that volatility estimate, regardless of how it was calculated. A multiplier of 1.5 keeps the band tight relative to current ATR; a multiplier of 3.5 keeps it wide. This is a separate decision from how the ATR itself is calculated.
A common beginner error is changing only the multiplier while troubleshooting too many false flips, when the actual issue might be an ATR period that's too short and therefore overreacting to a single noisy candle. Try adjusting each setting independently and observing the effect before changing both at once — otherwise you can't tell which change actually fixed (or broke) the behavior you were trying to adjust.
Why Default Settings Rarely Fit Your Chart
Most platforms ship SuperTrend with default values (commonly ATR Period 10, Multiplier 3) tuned for a general daily chart. If you drop those same defaults onto a 1-minute scalping chart or a highly volatile crypto pair, you'll usually get far more false signals than expected, because the volatility profile of that timeframe and asset is completely different from what the defaults were built for.
Rather than copying settings from a forum post, the more reliable approach is to test a few combinations yourself using TradingView's Bar Replay tool, directly on the timeframe and instrument you actually trade. Watch how often the trend flips during a normal sideways stretch — if it's flipping every few candles, your settings are too tight for that market's current volatility.
A Simple Tuning Process
- Start with the platform default (ATR 10, Multiplier 3) on your actual chart and timeframe.
- Scroll back to a stretch you know was clearly sideways/choppy. Count how many times the indicator flipped during that stretch.
- If it flipped more than roughly once every 15-20 candles during a known choppy period, widen the multiplier in steps of 0.5 and recheck.
- Then scroll to a stretch you know was clearly trending. Check how much profit the indicator gave back between the actual turning point and the moment it flipped. If that give-back feels excessive, consider tightening the multiplier slightly or shortening the ATR period instead.
- You're looking for the setting that keeps choppy-period flips manageable without giving back an unreasonable amount of the trending move. There's no perfect number — only a reasonable balance for your specific chart.
Where SuperTrend Breaks Down
Be honest with yourself about this limitation: SuperTrend is a trend-following tool, and trend-following tools lose money by design during sideways markets. There is no setting combination that fixes this — tightening or loosening the inputs only changes how the losses show up (many small false-flip losses versus fewer, slower exits), not whether they happen.
The practical fix isn't a better setting. It's pairing SuperTrend with something that tells you whether a trend actually exists before you trust its signal — an ADX reading above a threshold, for example, or simply recognizing a clear range on the chart and standing aside.
Why Pairing With ADX Specifically Helps
ADX (Average Directional Index) measures trend strength without caring about direction. A common approach is to only act on a SuperTrend flip when ADX is above a threshold like 20-25, treating readings below that as "the market isn't trending strongly enough to trust this signal right now." This doesn't eliminate false flips entirely, but it meaningfully reduces how many of them you act on, because weak-ADX periods are disproportionately where SuperTrend's whipsaw problem shows up.
A Simple Way to Use It Responsibly
- Check if the market is actually trending (higher highs/lows or lower highs/lows, or an ADX reading above your threshold) before trusting a flip.
- Use SuperTrend as your trend filter, not your only entry trigger — pair it with a separate confirmation signal, such as an RSI pullback or a price action breakout within the direction SuperTrend indicates.
- Size your stop-loss using the same ATR concept SuperTrend is built on, so your risk scales with current volatility instead of being a fixed number of points regardless of conditions.
- Re-check your settings when you switch timeframes or assets. Don't assume a 15-minute setup works on a 1-minute chart, or that settings tuned for one instrument transfer cleanly to another with a different typical volatility profile.
- Track your flips over time. If you notice the indicator flipping unusually often over a stretch of days, that's a signal the market's volatility regime may have shifted and your settings may need revisiting — not necessarily that the tool itself has stopped working.
Comparing SuperTrend to Other Trend Tools
It's useful to see how SuperTrend sits relative to other common trend-following tools, since the choice between them often comes down to which tradeoff you'd rather accept.
- SuperTrend vs. moving average crossovers: A moving average crossover (like a 10-EMA crossing a 50-EMA) is simpler but typically lags more, since it needs two separate averages to shift relative to each other before signaling. SuperTrend's volatility-adjusted band can react somewhat faster to a genuine shift, at the cost of being more sensitive to short bursts of volatility.
- SuperTrend vs. Parabolic SAR: Both are trailing-stop-style trend tools. Parabolic SAR accelerates its trailing distance over time within a trend, which can tighten stops faster during an extended move, but this also means it can get stopped out sooner during a brief pullback than SuperTrend's flatter ATR-based trail.
- SuperTrend vs. Ichimoku Cloud: Ichimoku provides a broader multi-component view (cloud, conversion line, base line) that captures both trend and support/resistance context in one overlay, but it has more components to interpret than SuperTrend's single flip-based signal, making it a steeper learning curve for a beginner.
None of these alternatives are objectively "better" — they represent different tradeoffs between responsiveness, interpretability, and the amount of give-back you'll tolerate during a trend's natural pullbacks.
There's a detailed breakdown worth reading
There's a detailed breakdown of tested settings across different timeframes and asset classes, including the trade-offs in false-flip frequency, in Quantzee's SuperTrend settings guide, which is a useful reference if you want starting points before you fine-tune on your own charts.
Common Mistakes Beginners Make With SuperTrend
- Trusting every flip equally. A flip that happens alongside a strong ADX reading and a clean breakout of a prior range carries more weight than a flip during a quiet, directionless stretch.
- Using it as a standalone entry trigger on fast timeframes. On a 1-minute or 5-minute chart, the whipsaw problem shows up far more often simply because there are more candles per hour in which price can cross the band back and forth.
- Never revisiting settings after market conditions change. A multiplier tuned during a low-volatility stretch can produce a flood of false flips once volatility picks up, and vice versa.
- Ignoring the direction of the higher timeframe. Taking every SuperTrend flip on a 15-minute chart regardless of what the 1-hour or daily trend is doing tends to produce more losing counter-trend trades.
- Assuming it predicts reversals. SuperTrend confirms a shift after price has already moved through the band — it is reactive by construction, not predictive.
Building a Complete System Around SuperTrend
SuperTrend answers one question well — trend direction — but a complete trading approach needs an entry trigger and a risk-sizing method layered on top. Here's one worked way to put the pieces together, step by step, so the logic isn't abstract.
- Set your bias with SuperTrend on your primary timeframe. If the line is green and price is holding above it, you're only looking for long setups. If red, only short setups. No trades against the current flip.
- Check trend strength with ADX before acting on a fresh flip. A flip that occurs with ADX below roughly 20 is more likely to be a false signal inside a ranging market; treat it with more skepticism or skip it entirely.
- Wait for a secondary trigger within the direction SuperTrend favors. This might be an RSI pullback toward the 40 zone followed by a turn back up (in an uptrend), or a clean break of a short consolidation range in the direction of the flip.
- Size your stop using the current ATR value — the same volatility figure SuperTrend itself is built from — rather than a fixed point distance. A common approach is placing the stop just beyond the SuperTrend line itself, since a true trend reversal should also flip that line.
- Exit or trail as the SuperTrend line moves with you. Because the line only moves in the favorable direction during an active trend, it naturally functions as a trailing stop without needing a separate exit indicator.
Walking through a concrete scenario: price on a 1-hour chart flips to a SuperTrend uptrend with ADX reading 27 (comfortably above the 20 threshold). Over the next several candles, RSI — which had spiked to 68 right at the flip — pulls back to 42 and turns upward. That pullback-and-turn is the entry trigger. Current ATR(10) on this chart reads 18 points. The stop is placed just below the current SuperTrend line, roughly 24 points below entry in this example. As price continues higher over the following sessions, the SuperTrend line ratchets upward behind it, trailing the stop without any manual adjustment, until price eventually closes back below the line and the position exits on that flip.
This kind of layered approach — bias, strength filter, trigger, and volatility-based stop — is a recurring pattern across most workable trend-following systems, not just ones built around SuperTrend specifically. Swapping SuperTrend for a different trend tool wouldn't change the overall structure; it would still need the same four layers to function as a complete system rather than a single signal.
FAQ
What's the best SuperTrend setting?
There isn't one universal best setting — it depends on your timeframe and how much noise you can tolerate. Shorter ATR periods and smaller multipliers react faster but flip more often; longer periods and larger multipliers are slower but filter out more noise.
Why does SuperTrend keep giving false signals?
Usually because the market is ranging, not trending. SuperTrend is a trend-following tool, and it performs poorly by nature in sideways conditions regardless of settings.
Is SuperTrend enough on its own?
On its own, it tells you trend direction, not when to enter or how to size risk. Most traders pair it with a momentum or volume tool for entries and use ATR separately for stop-loss sizing.
Does SuperTrend work on all timeframes?
It can be applied to any timeframe, but the settings that work well on a daily chart almost never work well unchanged on a 1-minute chart, because the underlying ATR values and typical noise levels differ substantially between timeframes.
How is SuperTrend different from a simple trailing stop?
Conceptually they're very similar — both trail price at a volatility-based distance and only move in the favorable direction. The difference is that SuperTrend is plotted as a visible chart overlay with its own buy/sell flip signals, whereas a manual trailing stop is usually just applied to a position you've already entered through some other signal.
Can SuperTrend be combined with volume indicators?
Yes. Some traders add a volume confirmation step, only trusting a SuperTrend flip if it's accompanied by above-average volume on the flip candle, as a rough filter against low-conviction moves.
Does a higher multiplier always mean fewer losing trades?
Not necessarily. A higher multiplier reduces the number of false flips during choppy stretches, but it also means giving back more profit before a genuine trend reversal triggers an exit. Fewer trades isn't the same as a better overall result — it shifts where the losses and give-backs show up rather than removing them.
Should beginners start with a longer or shorter ATR period?
A longer ATR period (14-21) is generally easier for beginners to work with because it produces a smoother, less reactive line, making it simpler to see whether a flip reflects a genuine shift versus a single noisy candle. Shorter periods can be introduced later once you have a feel for how the indicator behaves on your specific chart.
Why does SuperTrend look great on a trending stock chart but terrible on an index during a quiet month?
This is the trend/range distinction playing out directly. A stock in a clear multi-week uptrend gives SuperTrend exactly the conditions it's built for — minimal whipsaw, clean trailing behavior. An index chopping sideways for weeks is the opposite scenario, generating repeated false flips regardless of how well the settings are tuned, because no setting adjustment can manufacture a trend that isn't there.
Is it worth paying for a premium version of SuperTrend?
The core SuperTrend calculation is identical whether it's the free built-in version or a paid variant — ATR, a multiplier, and a flip rule. Paid versions typically add visual extras like colored zones, alert automation, or multi-timeframe dashboards, which can save time but don't change the underlying signal logic or its fundamental limitation in ranging markets.
The core takeaway is simple even if the settings aren't: SuperTrend is a volatility-adjusted trailing line, not a crystal ball. It does one job — telling you the current direction a trend has already established, and trailing a stop behind it while that trend holds. Judge it on that single job, pair it with a strength filter and an entry trigger rather than expecting it to do everything alone, and revisit your settings periodically as the volatility of your chosen chart shifts over time.
This article is for educational purposes only and is not investment advice. Past performance of any indicator or strategy does not guarantee future results.