These 3 altcoins may reach new all-time highs in February.

These altcoins are trending upward and may reach new all-time highs in February.
The start of 2024 has led to mixed price action in the cryptocurrency market. While new highs were observed in the first half of the month, a significant correction occurred in the latter half. Bitcoin Magazine will review the top altcoins in February that could potentially achieve new all-time highs.
Celestia (TIA) could reach a new ATH after bouncing up from the support line.
The price of TIA has been on an upward trajectory along with an ascending support line since the beginning of November 2023. The upward movement led to a new all-time high of $20.40 on January 15, 2024.
Although the price of TIA has decreased since then, it rebounded on January 23, confirming the ascending support line and a horizontal support area at $14.40. As of now, the trendline has been in existence for 86 days.
While the price is making a comeback, the Relative Strength Index (RSI) is also increasing (highlighted in the green circle). Market traders often use the RSI as a momentum indicator to identify overbought or oversold conditions and to decide whether to accumulate or sell an asset.
An RSI above 50 and trending upwards indicates that the bullish momentum is prevailing, whereas an RSI below 50 suggests the opposite.
If the upward momentum continues, TIA could potentially rise by 43% to the next resistance level at $24.60.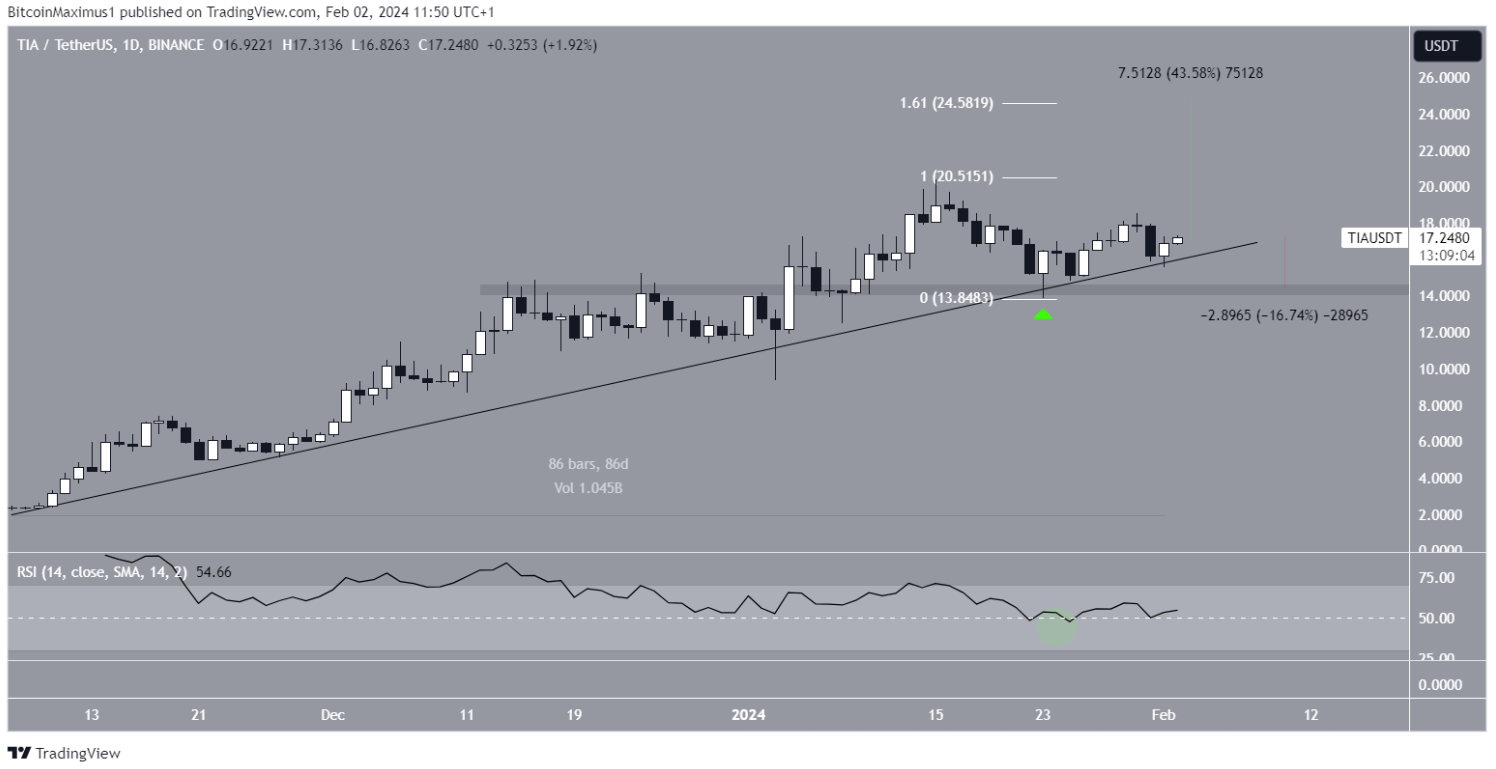
Despite this bullish prediction, breaking the ascending trendline support could lead to a 16% price decrease to the support zone at $14.40.
PENDLE Rides the Parabolic Trend
The price of PENDLE has been ascending along with the parabolic trendline since August 2023. The trendline has been validated multiple times, most recently on January 10, 2024 (highlighted in the green icon). The pace of the ascent has further increased after the bounce.
The wave count suggests that PENDLE is in the fifth and final wave of the upward movement. Technical analysts use Elliott Wave Theory to determine the trend direction by studying long-term price patterns and investor psychology.
Since the fifth wave is longer than 0.618 times the length of waves one and three, it may extend by the total length of the two preceding waves.
If the upward momentum continues, PENDLE could potentially reach a new all-time high at $3.30, representing a 15% increase from the current price.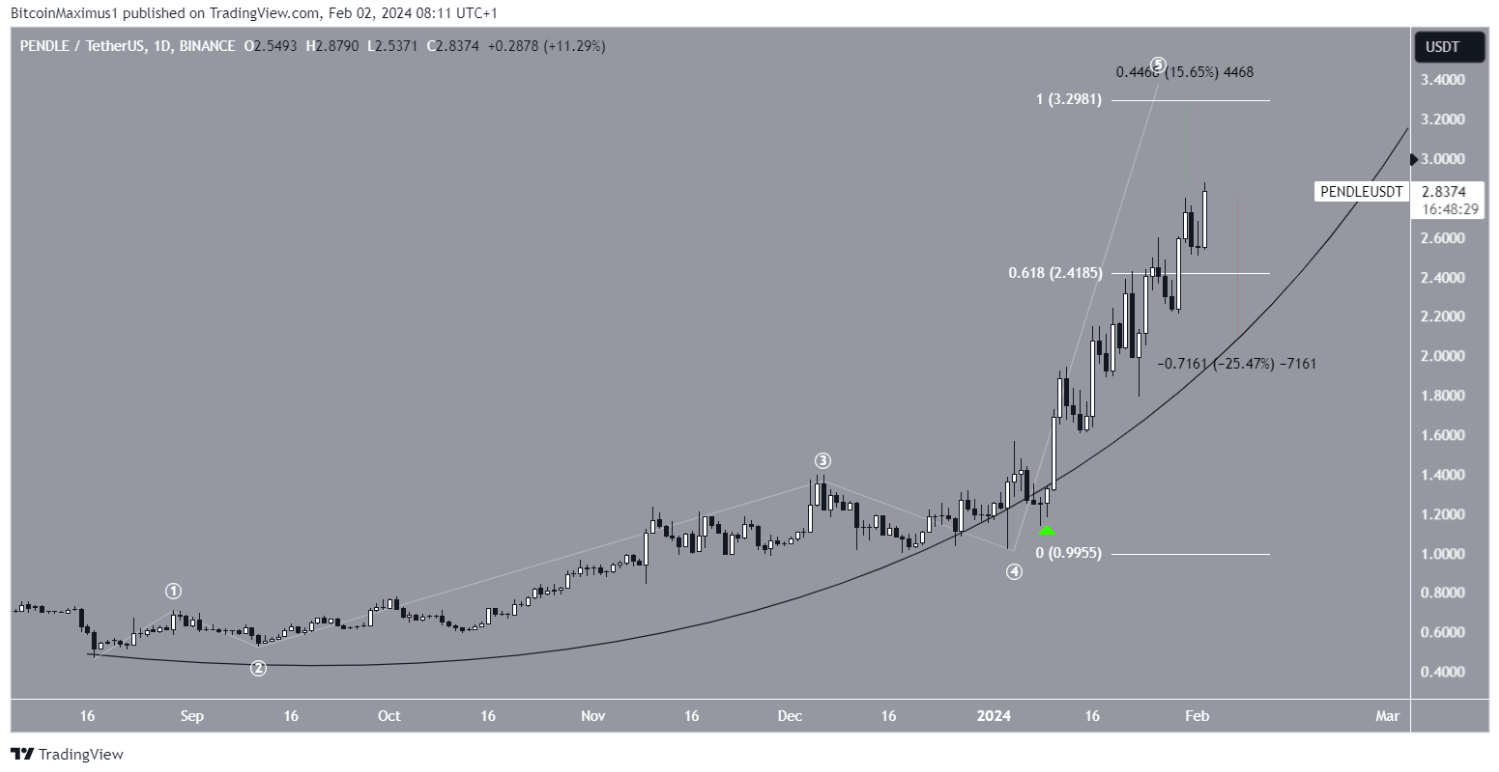
Despite this bullish prediction, closing below $2.40 could result in a 25% price drop to the parabolic trendline support at $1.90.
Render (RNDR) Concludes Altcoins' Potential All-Time Highs:
Weekly technical analysis indicates that RNDR has been following an upward movement consisting of 5 waves since June 2023. If the wave count is accurate, RNDR is currently in the fifth and final wave of this upward movement.
The price bounced at the beginning of the year, confirming the horizontal support zone at $3.60 (highlighted in the green icon) and initiating the fifth wave. If so, the fifth wave could extend to $8.35, representing a 75% increase from the current RNDR price. This would mark a potential new all-time high.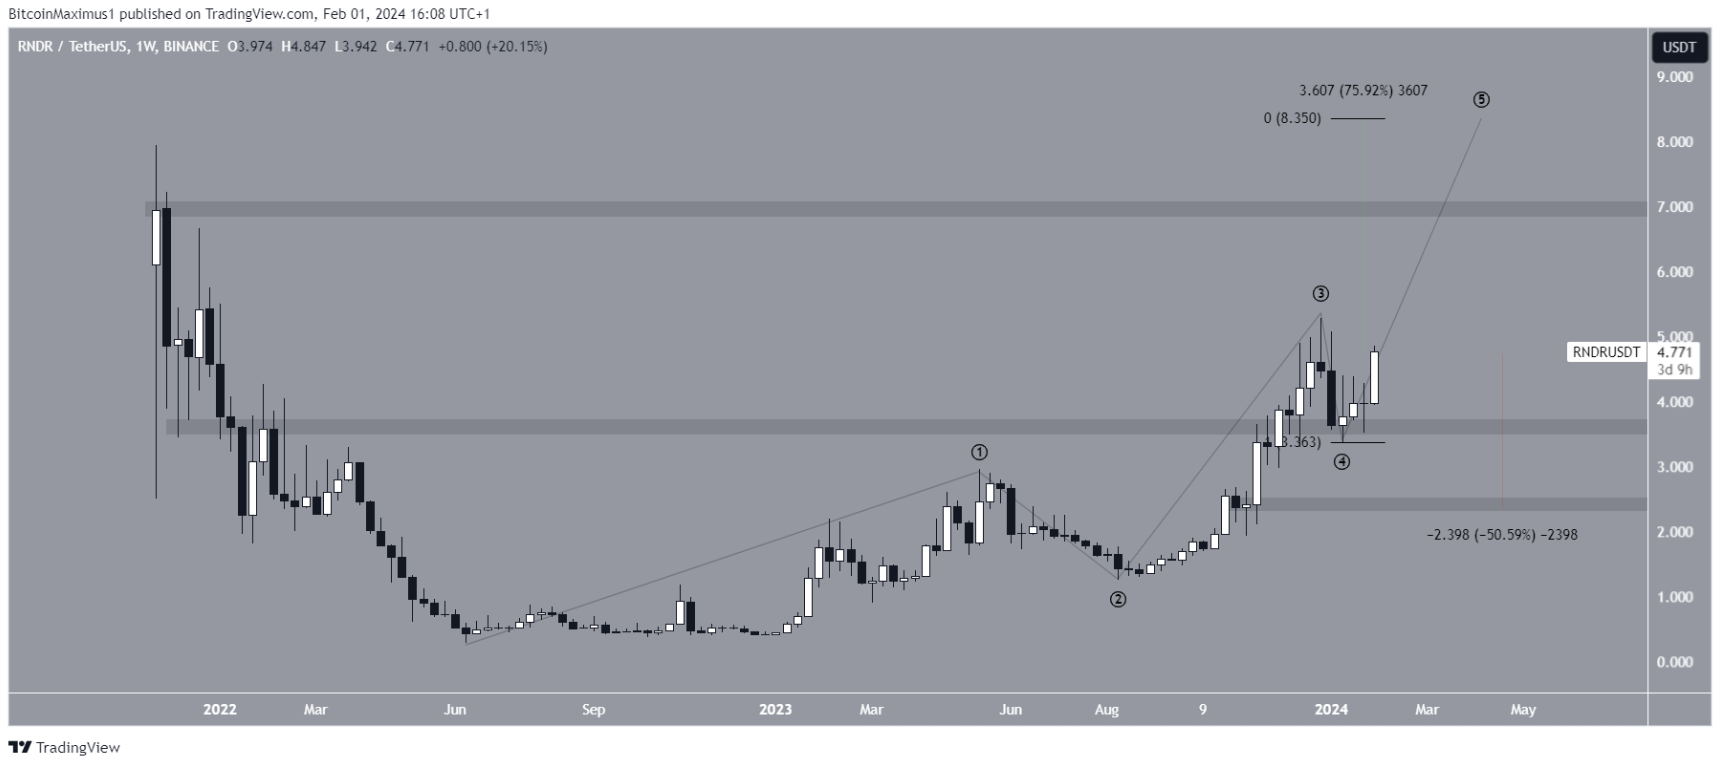
Despite this bullish prediction, closing below $3.60 would invalidate the wave count. Subsequently, RNDR could experience a 50% decline to the nearest support level around $2.40.