6
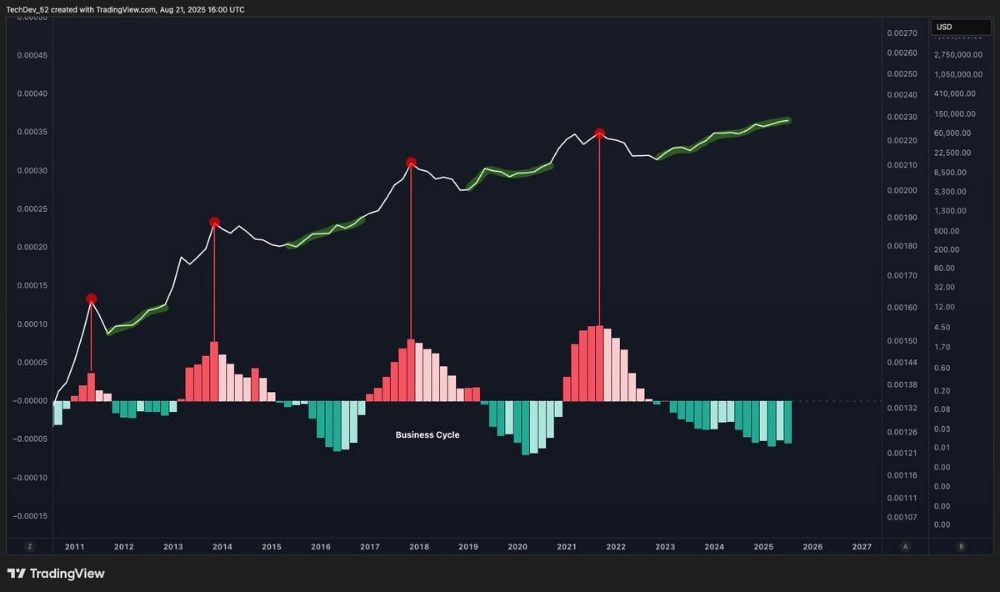
🕯Bitcoin and the Business Cycle
This chart overlays Bitcoin’s price with the business cycle oscillator - a macro tool tracking expansions (green) and contractions (red).
Here’s what stands out:
➡️ Every single Bitcoin cycle top (2013, 2017, 2021) aligned exactly with the peak of the red bar section.
➡️ Those peaks marked overheated macro conditions - late-stage liquidity, risk assets maxed, and BTC euphoria.
Bitcoin doesn’t top in the middle of growth phases.