SOL/USDT 15m timeframe
27
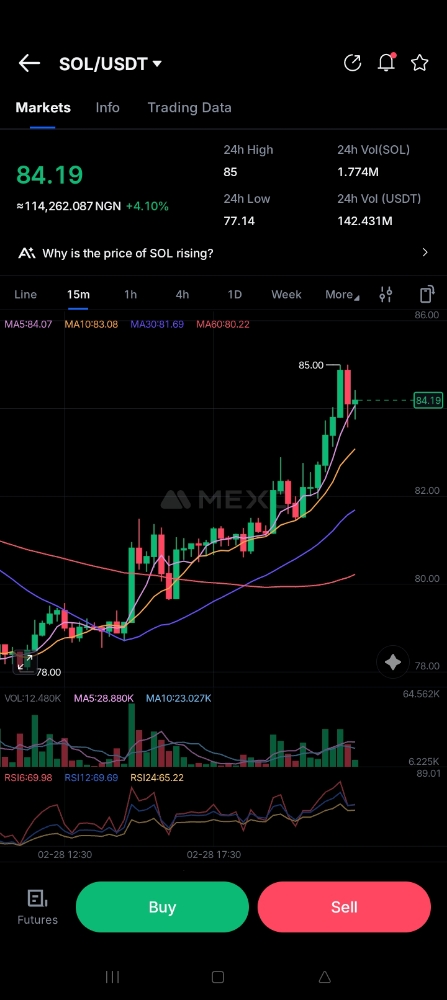
You’re looking at SOL/USDT (15m timeframe) around $84.16. Let’s break it down clearly 👇
📈 Trend Overview (15m Chart)
- Strong short-term uptrend
- Price recently pushed from ~$78 → $85
- Higher highs & higher lows structure intact
- Price is trading above all key MAs (MA10, MA30, MA60) → bullish momentum
Moving Averages:
- MA10 ≈ 83.08
- MA30 ≈ 81.69
- MA60 ≈ 80.22
- 👉 Bullish alignment (short MA above long MA)
📊 Momentum & Indicators
🔥 RSI
- RSI ≈ 69–70
- Near overbought zone (70+)
This means:
- Buyers are strong
- But short-term pullback is possible
📦 Volume
- Volume increased during breakout toward $85
- Slight decrease on the last candle → possible pause / minor correction
🧱 Key Levels
🟢 Resistance
- $85 (recent high)
- If broken strongly → next zone: $87–$88
🔵 Support
- $83 (short-term support)
- $81.50–$82 (stronger support zone)
- $80 psychological level
📌 What Could Happen Next?
Scenario 1 (Most Likely Short-Term)
Small pullback to $83–$82
Then continuation upward if buyers defend it.
Scenario 2 (Bullish Breakout)
Clean break above $85 with strong volume
→ Move toward $87–$88
Scenario 3 (Short-Term Correction)
If $82 breaks
→ Possible drop toward $80–$79
🎯 Trading Perspective (Not Financial Advice)
Since you're building long-term stability (as you mentioned before), here’s the smart approach:
- Avoid FOMO buying near resistance ($85)
- Better entries are on pullbacks ($82–$83 area)
- Always use stop-loss if trading futures
- If spot holding → trend still bullish short term