Exploring Solana's 2024 Outlook and Market Potential

 Solana (SOL) has decreased in 2024 after reaching a high of $126 in December 2023. The decrease has been contained inside a symmetrical triangle.
The SOL price is approaching the end of this pattern, so a decisive movement outside could occur soon.
Solana Creates Consecutive Bearish Weekly Candlesticks
The value of SOL has been on an upward trajectory since it broke through a descending resistance trend line in July 2023.
SOL created a higher low in September and accelerated its rate of increase afterward. This climb peaked at $126 in December, marking the culmination of the upward movement that had been ongoing the entire year.
More importantly, this surge led to a breakthrough above the 0.382 Fibonacci retracement resistance level. Despite this achievement, the price faced difficulty surpassing a long-term horizontal resistance area.
Recently, there has been a downturn causing SOL’s price to fall below the Fib level, categorizing the prior breakout as a deviation (red circle).
SOL created consecutive bearish weekly candlesticks for the first time since October 2023. Nevertheless, the price has regained its footing somewhat this week. When evaluating market conditions, traders use the RSI as a momentum indicator to determine whether a market is overbought or oversold and whether to accumulate or sell an asset.
Bulls still have an advantage if the RSI reading is above 50 and the trend is upward. The opposite is true if the reading is below 50.
The RSI shows mixed readings since, while it is falling, it has generated a hidden bullish divergence (green), a sign of strength.
Will 2024 Be Solana’s Year?
The Solana team tweeted its 2024 outlook on January 11. The report shows that more than 2,500 developers are working in the Solana Network. It also has other positive stats, such as increased developer retention and market activity.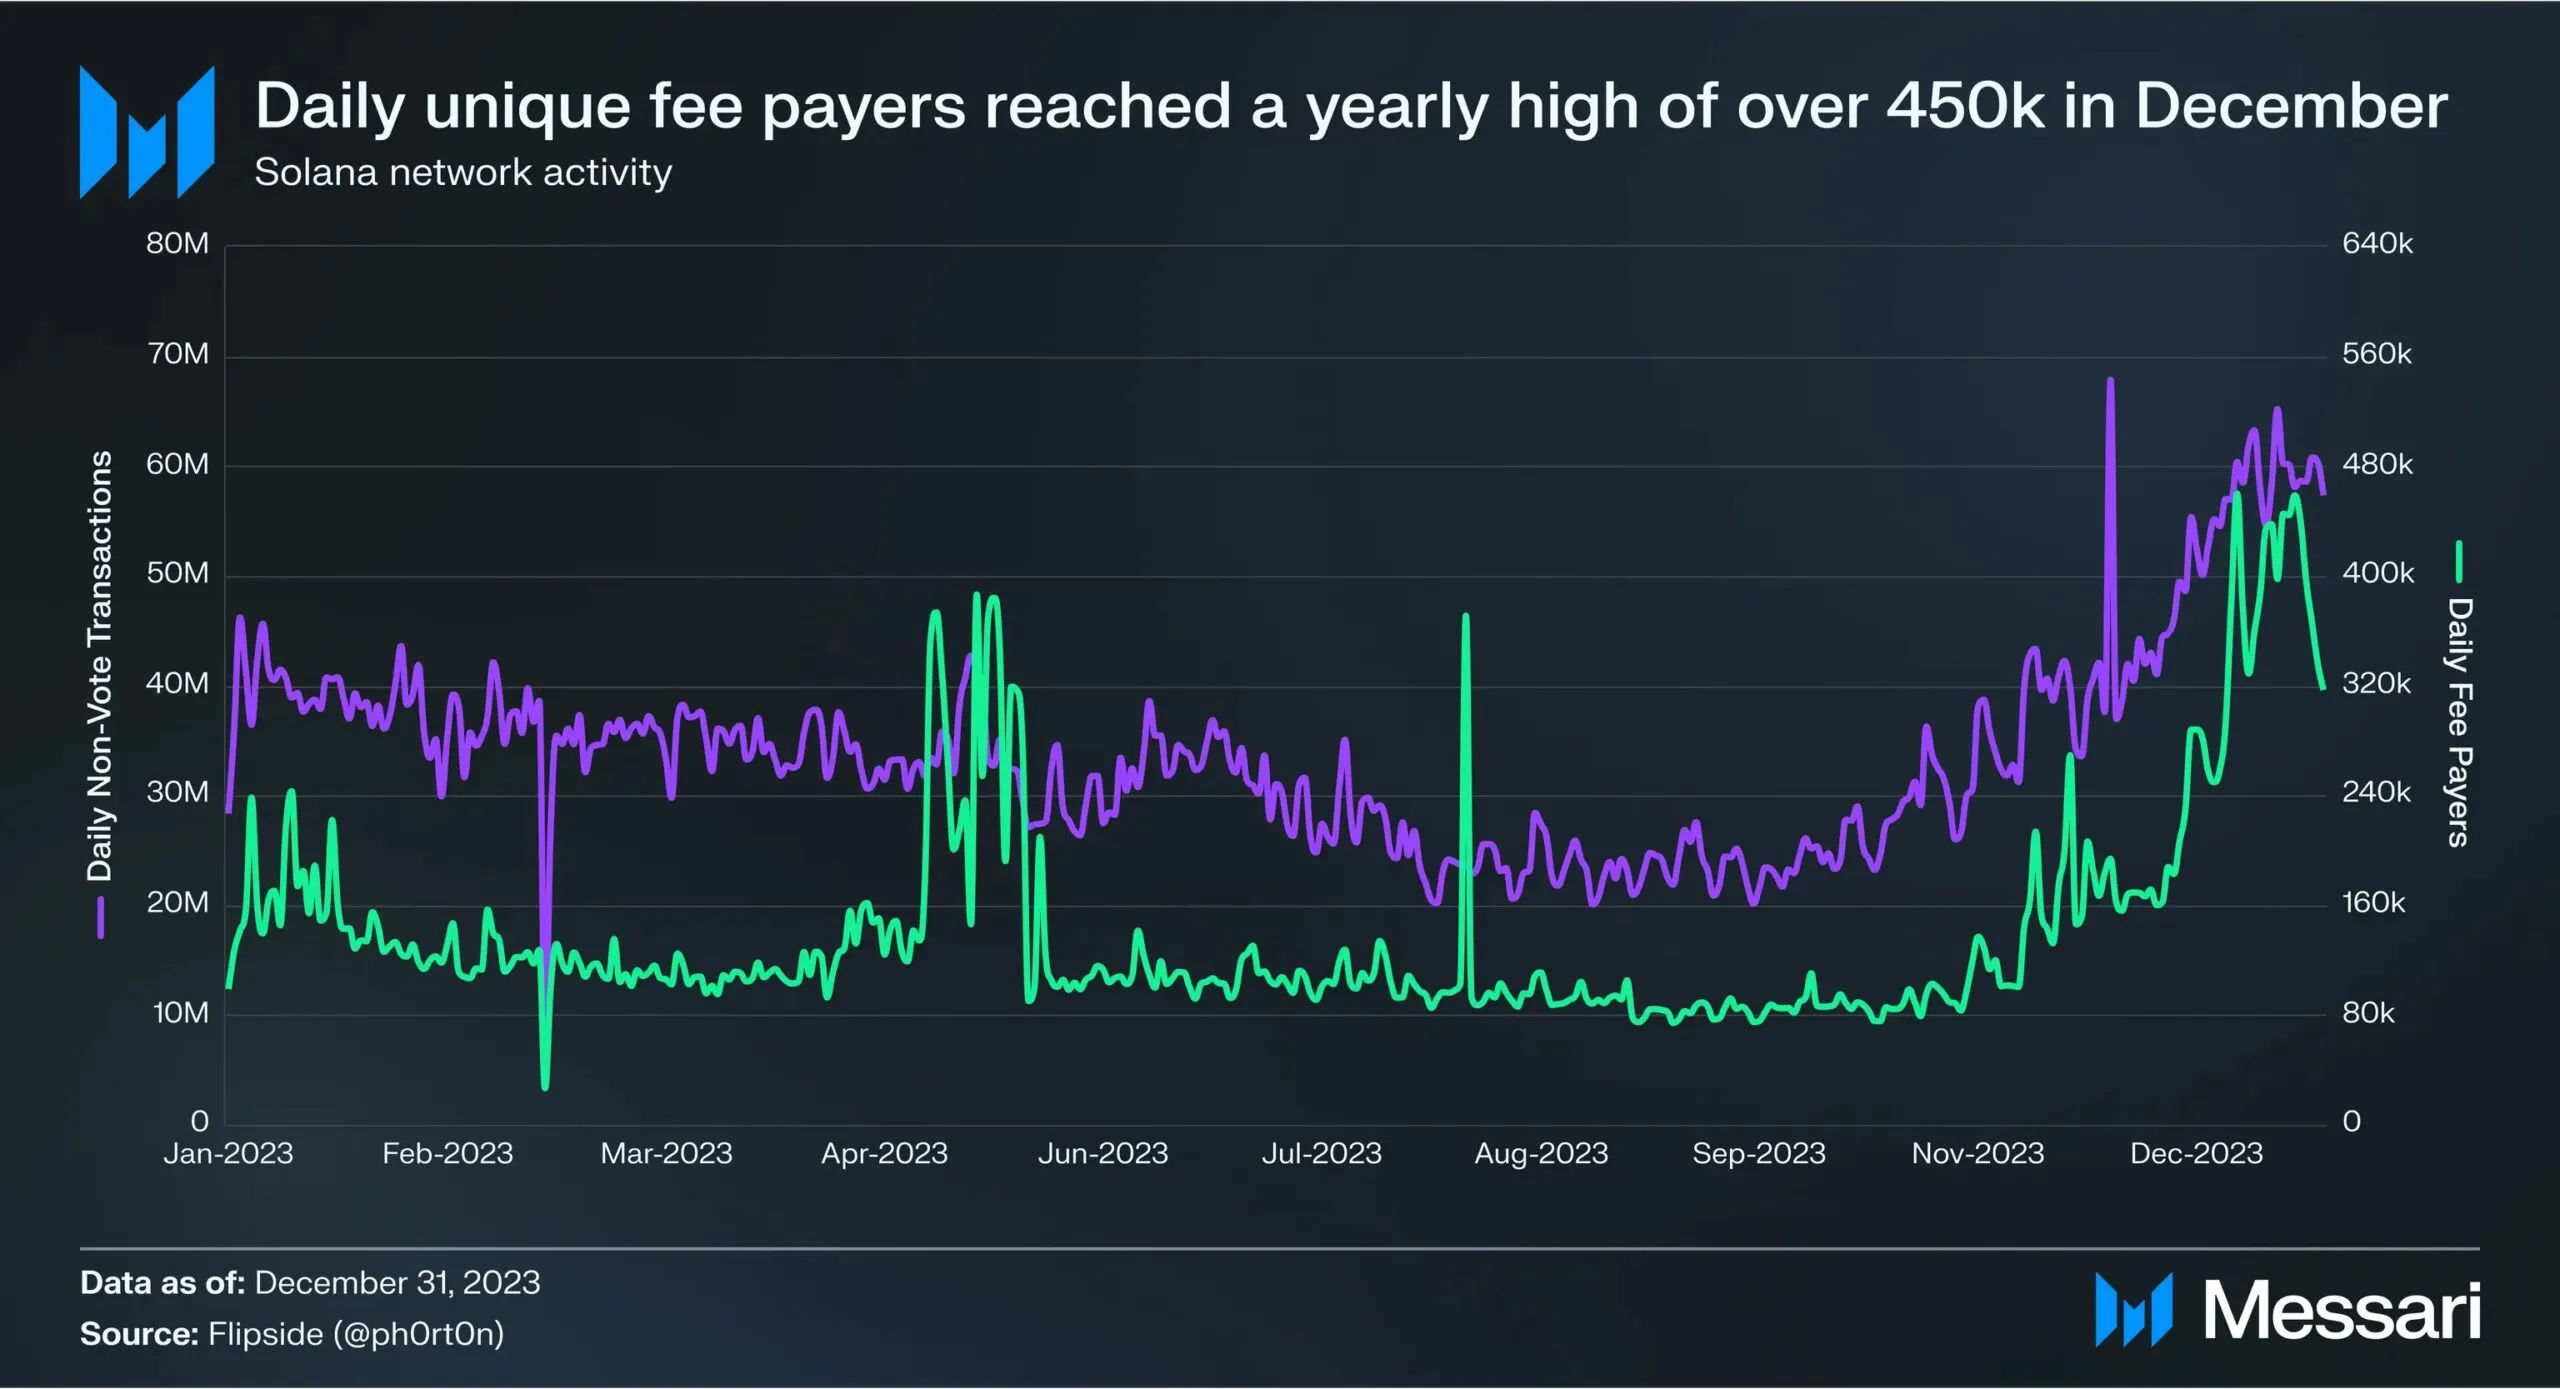 Solana Network Activity Chart. Source: X
The outlook for 2024 shows that there are new upcoming features, such as token extensions, which will make token creation on Solana more flexible. These extensions will include confidential transfers, transfer hooks, and metadata pointers.
SOL Price Prediction: When Will Price Reclaim $100?
The technical analysis in the daily time frame suggests that SOL will resume its increase after a correction.
Technical analysts use the Elliott Wave theory to determine the direction of a trend, which involves studying recurring long-term price patterns and investor psychology. The most likely count stated that SOL is in wave four of a five-wave upward movement that started in June 2023 (white).
Wave four often takes the shape of a triangle, so this may occur in SOL.
In that case, SOL has reached its low point of the correction with a bounce on January 8 (green icon). This validated the triangle’s support trend line and the 0.382 Fib retracement support level. Solana could consolidate for the rest of the month before eventually breaking out.
The breakout from the triangle will confirm the count and trigger a 75% increase to the next resistance at $168, created by the 0.618 Fib retracement resistance level.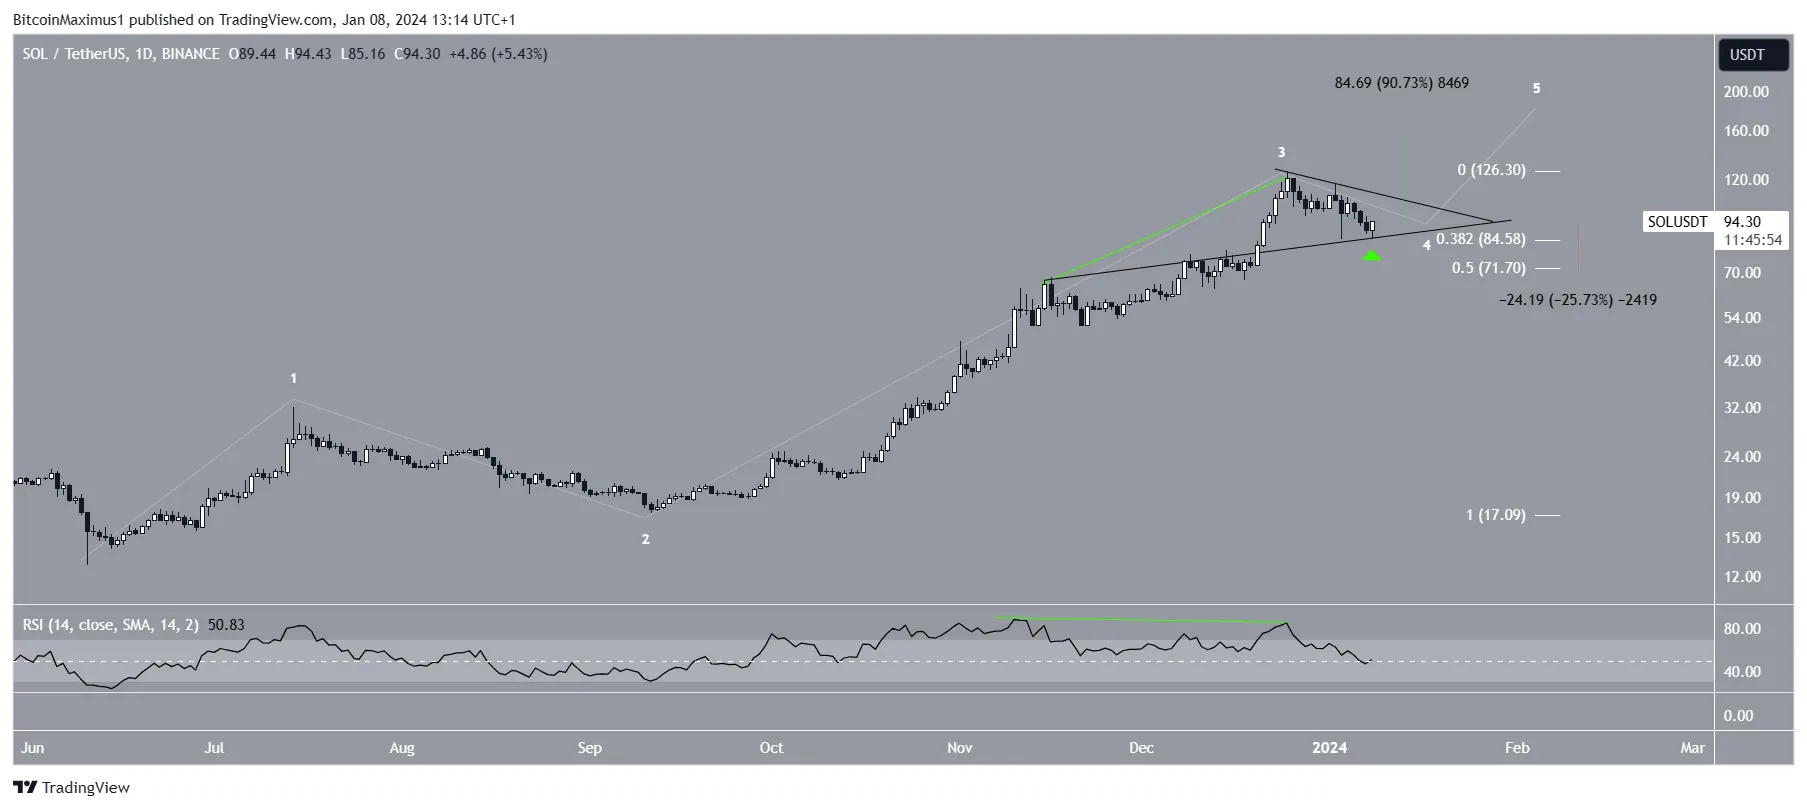 SOL/USDT Daily Chart. Source: TradingView
Despite this bullish SOL price prediction, a breakdown from the triangle will invalidate the count.
In that case, a 28% drop to the closest support at $72 is foreseeable, validating the 0.5 Fib retracement support level and the resistance of a long-term ascending parallel channel.