Decoding Shiba Inu’s descending triangle – Is an 18% price drop coming next?

The demand for SHIB has declined over the past month, hinting at a possible decline below $0.00002.
 Abiodun Oladokun
Journalist
Edited By: Jibin Mathew George
Posted: May 4, 2024
Share this article
- SHIB’s next price point may be under $0.00002
- However, if bullish momentum climbs, the memecoin may exchange hands above $0.00003
An assessment of Shiba Inu’s [SHIB] price movements on the 3-day chart has revealed the formation of a descending triangle. A descending triangle is formed when an asset’s price is bound between the support and resistance lines, forming a triangular shape on the chart.
An asset’s price can either break below support and continue its decline or break out of the triangle and initiate an uptrend.
What next for SHIB?
AMBCrypto’s readings of SHIB’s Fibonacci retracement revealed that if the bears put further downward pressure on its price and it breaks below support, the memecoin’s price might decline further by 18% to trade at a low of $0.000018.
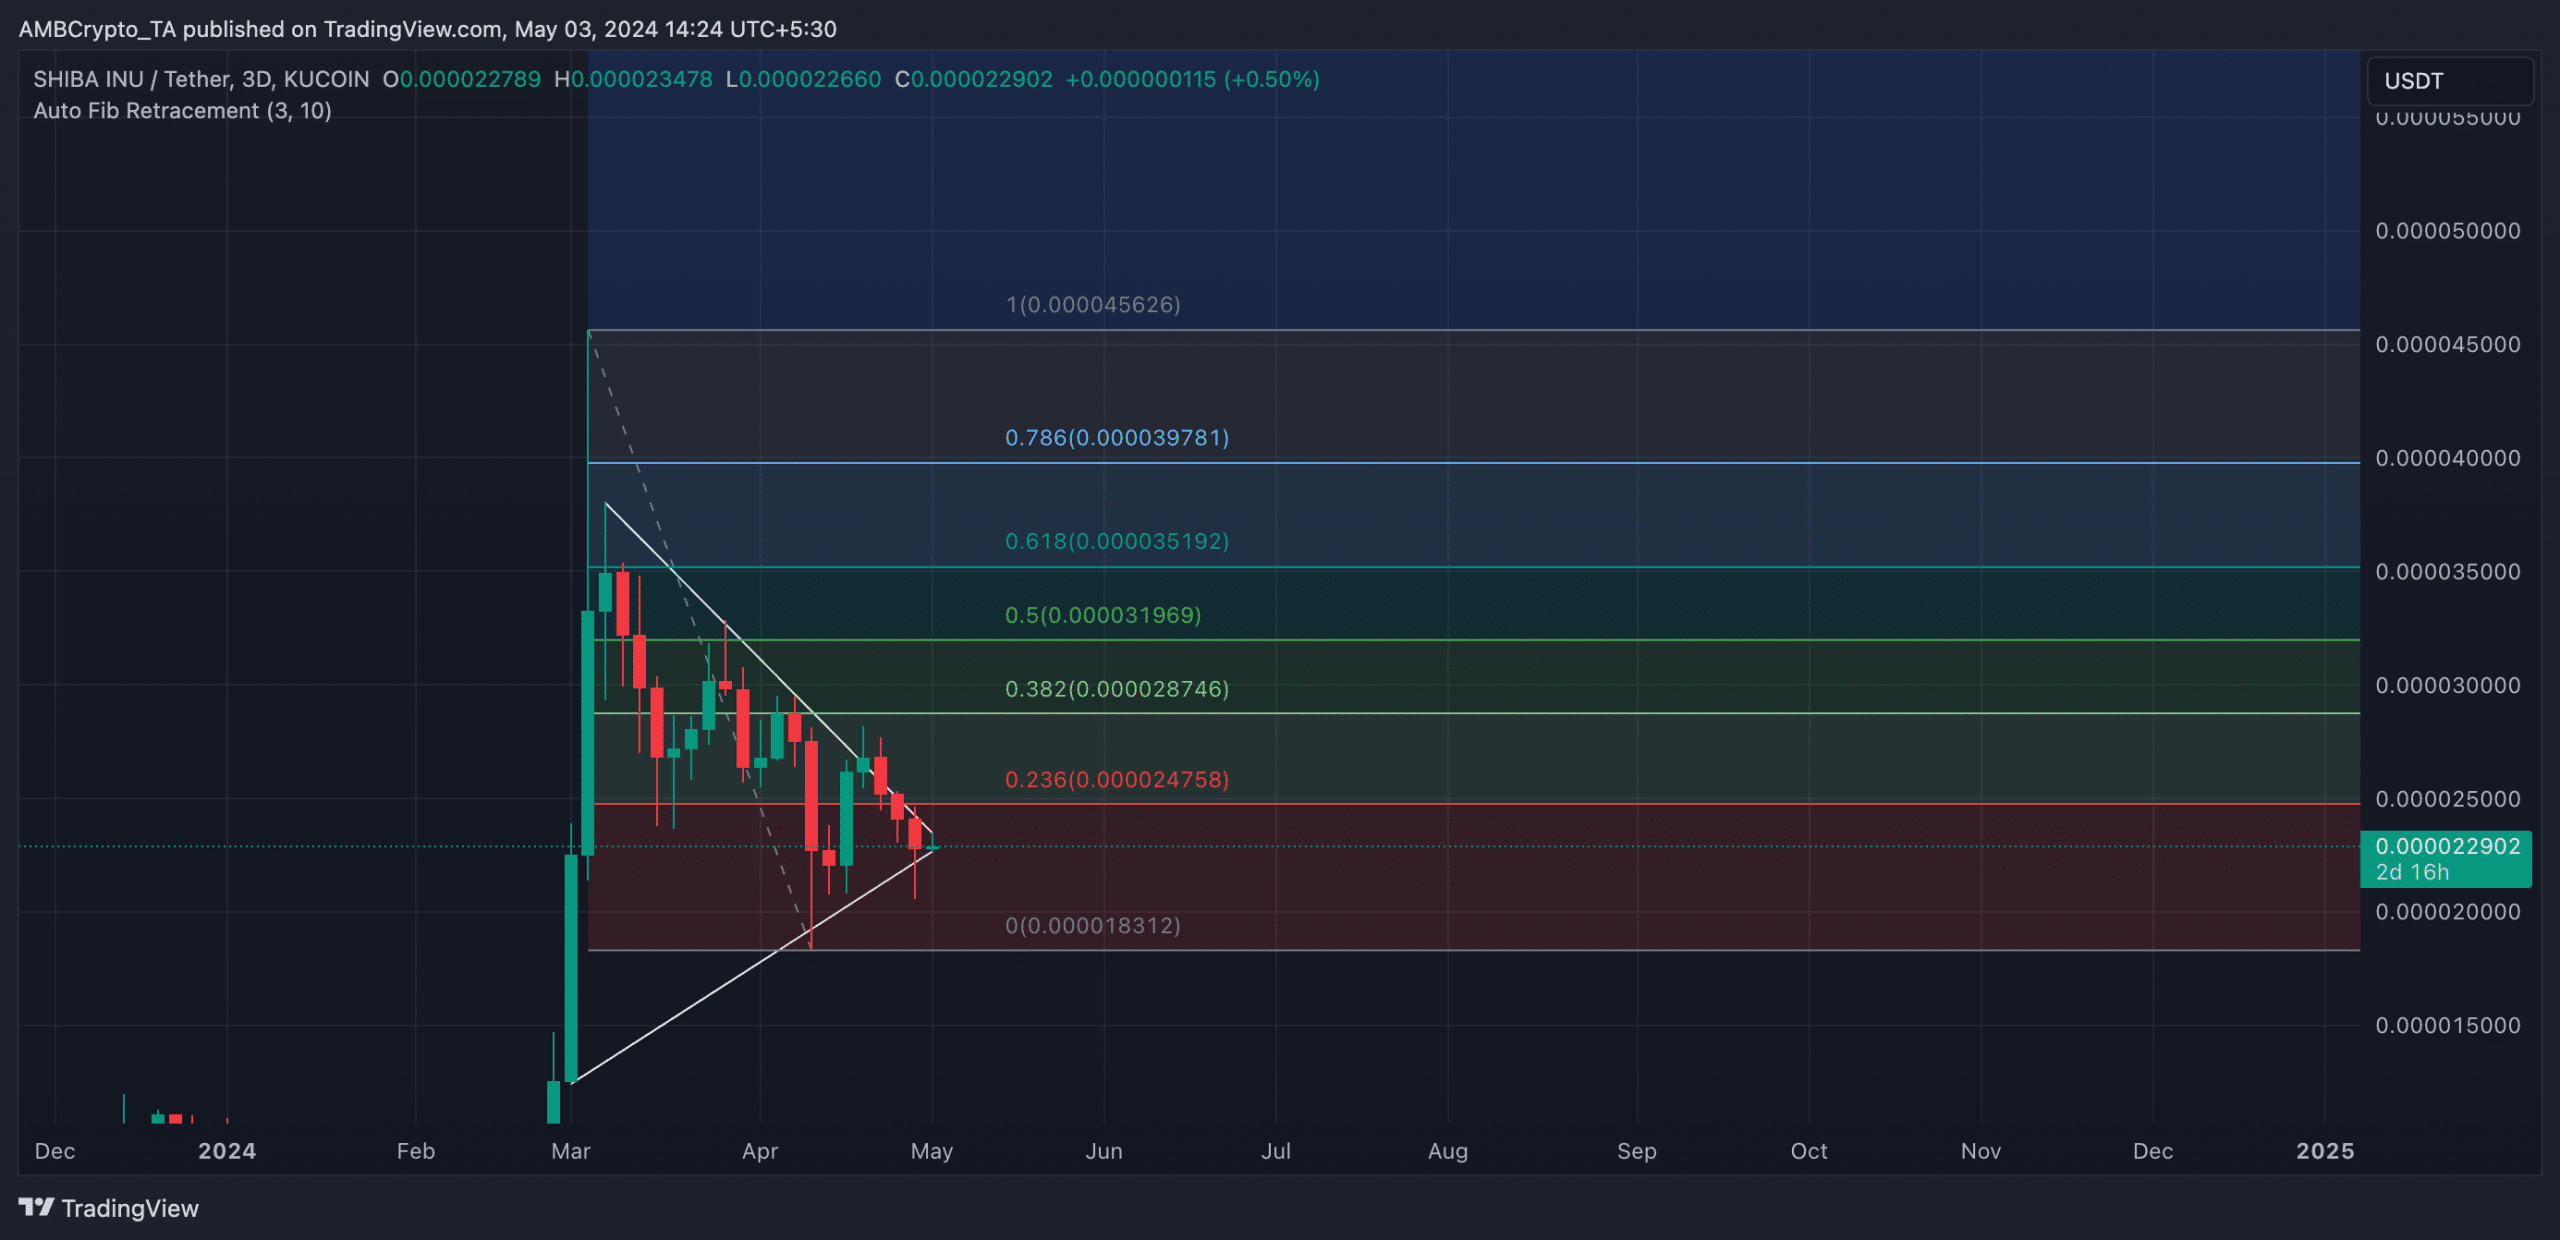 Source: Trading View
This decline appears possible as the coin continues to register a fall in demand. According to Santiment’s data, SHIB’s daily active addresses observed on a 30-day moving average revealed a 56% decline in the daily count of addresses involved in SHIB’s transactions over the past month.
Likewise, new demand for the memecoin has plunged. In fact, according to the on-chain data provider, the number of new addresses created to trade SHIB daily has dropped by 51% over the same period. 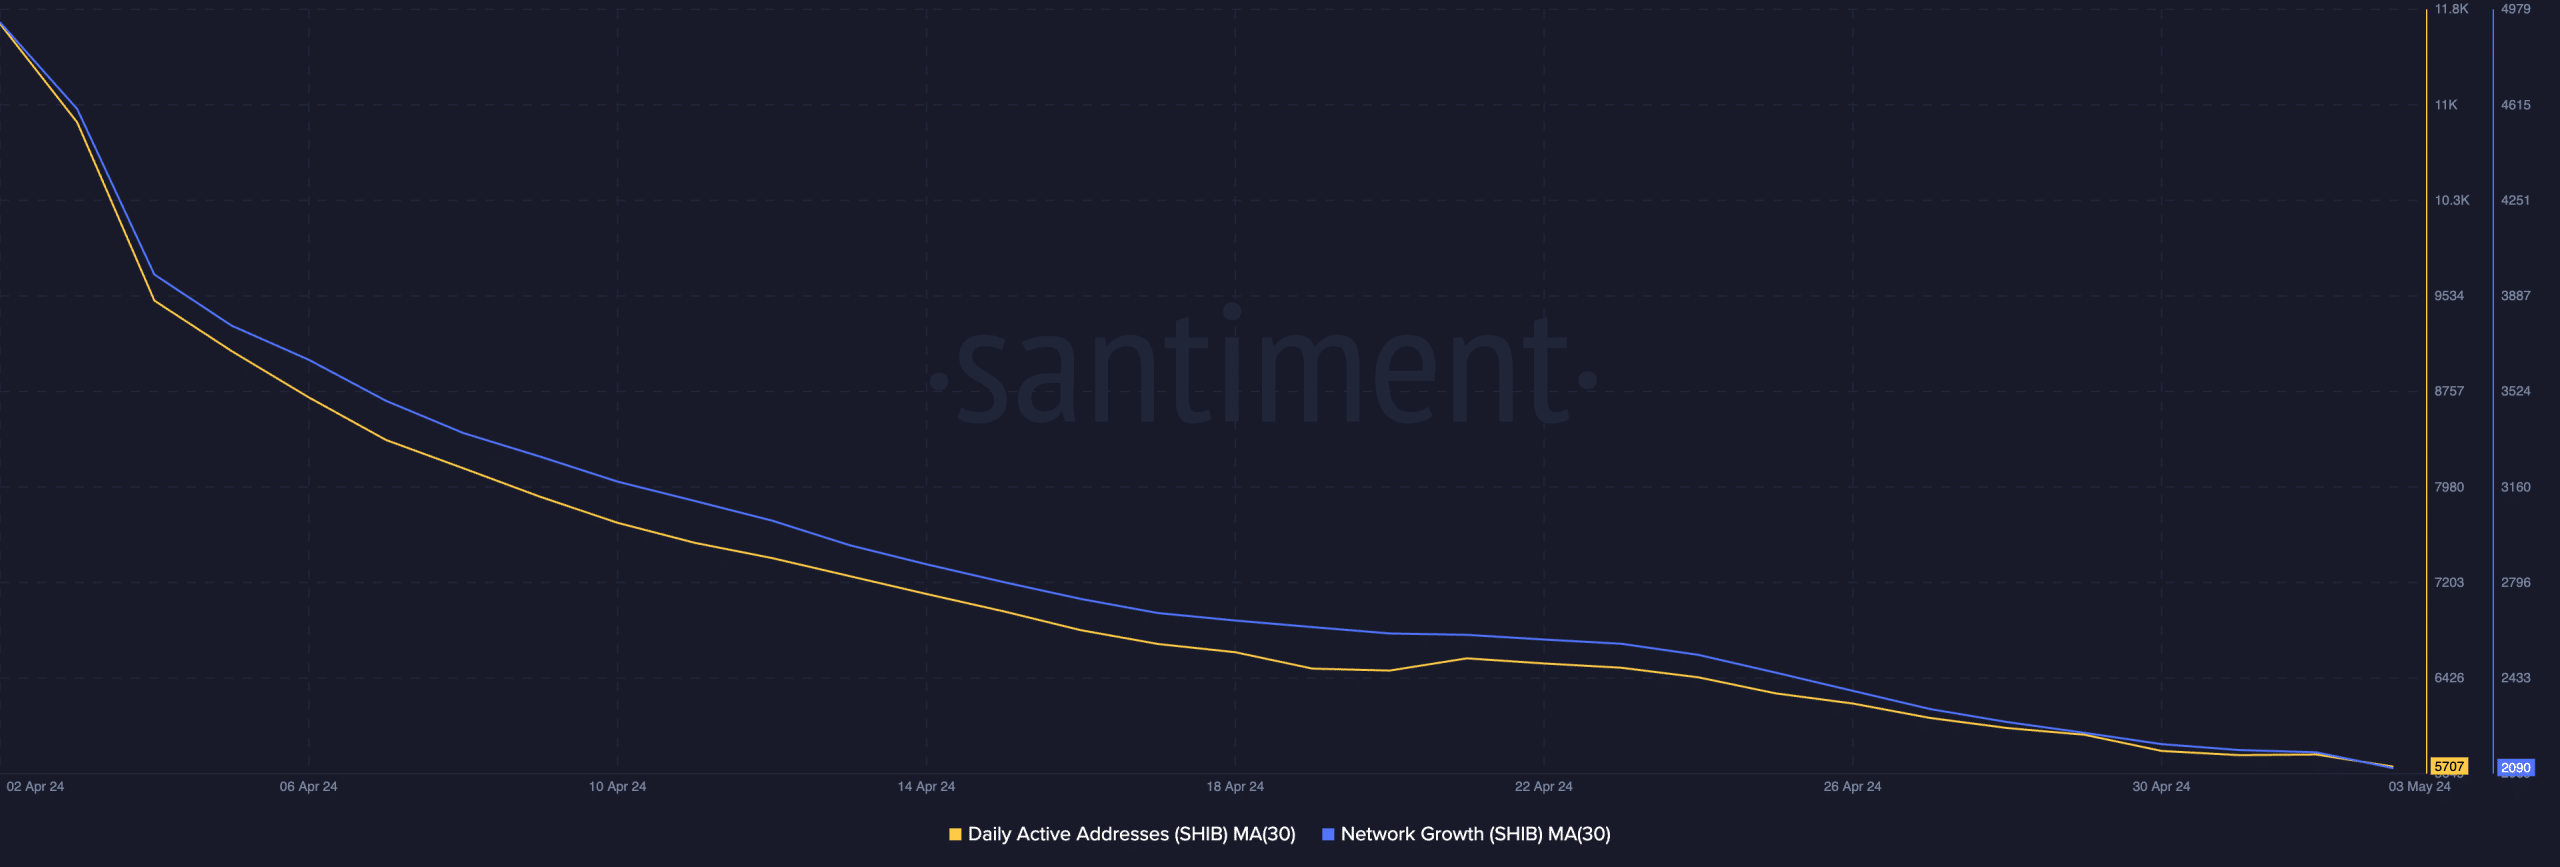 Source: Santiment
A decline in the number of active addresses trading an asset is often a precursor to low trading volume. When this decline is persistent, the downward pressure on the asset’s price mounts.
The predicted fall below $0.0002 is possible if SHIB continues to record a decline in its demand.
Read Shiba Inu (SHIB) Price Prediction 2024-25
Furthermore, SHIB’s high Market Value to Realized Value (MVRV) ratio puts it at risk of increased selling pressure. This metric measures the ratio between an asset’s current market price and the average price of every coin or token acquired for that asset.
At press time, SHIB’s MVRV ratio was 38.28% and heading north. When an asset’s MVRV ratio is positive in this manner, the asset is deemed to be overvalued. This means that a significant number of asset holders are “in the money,” triggering the need to sell and lock in profits.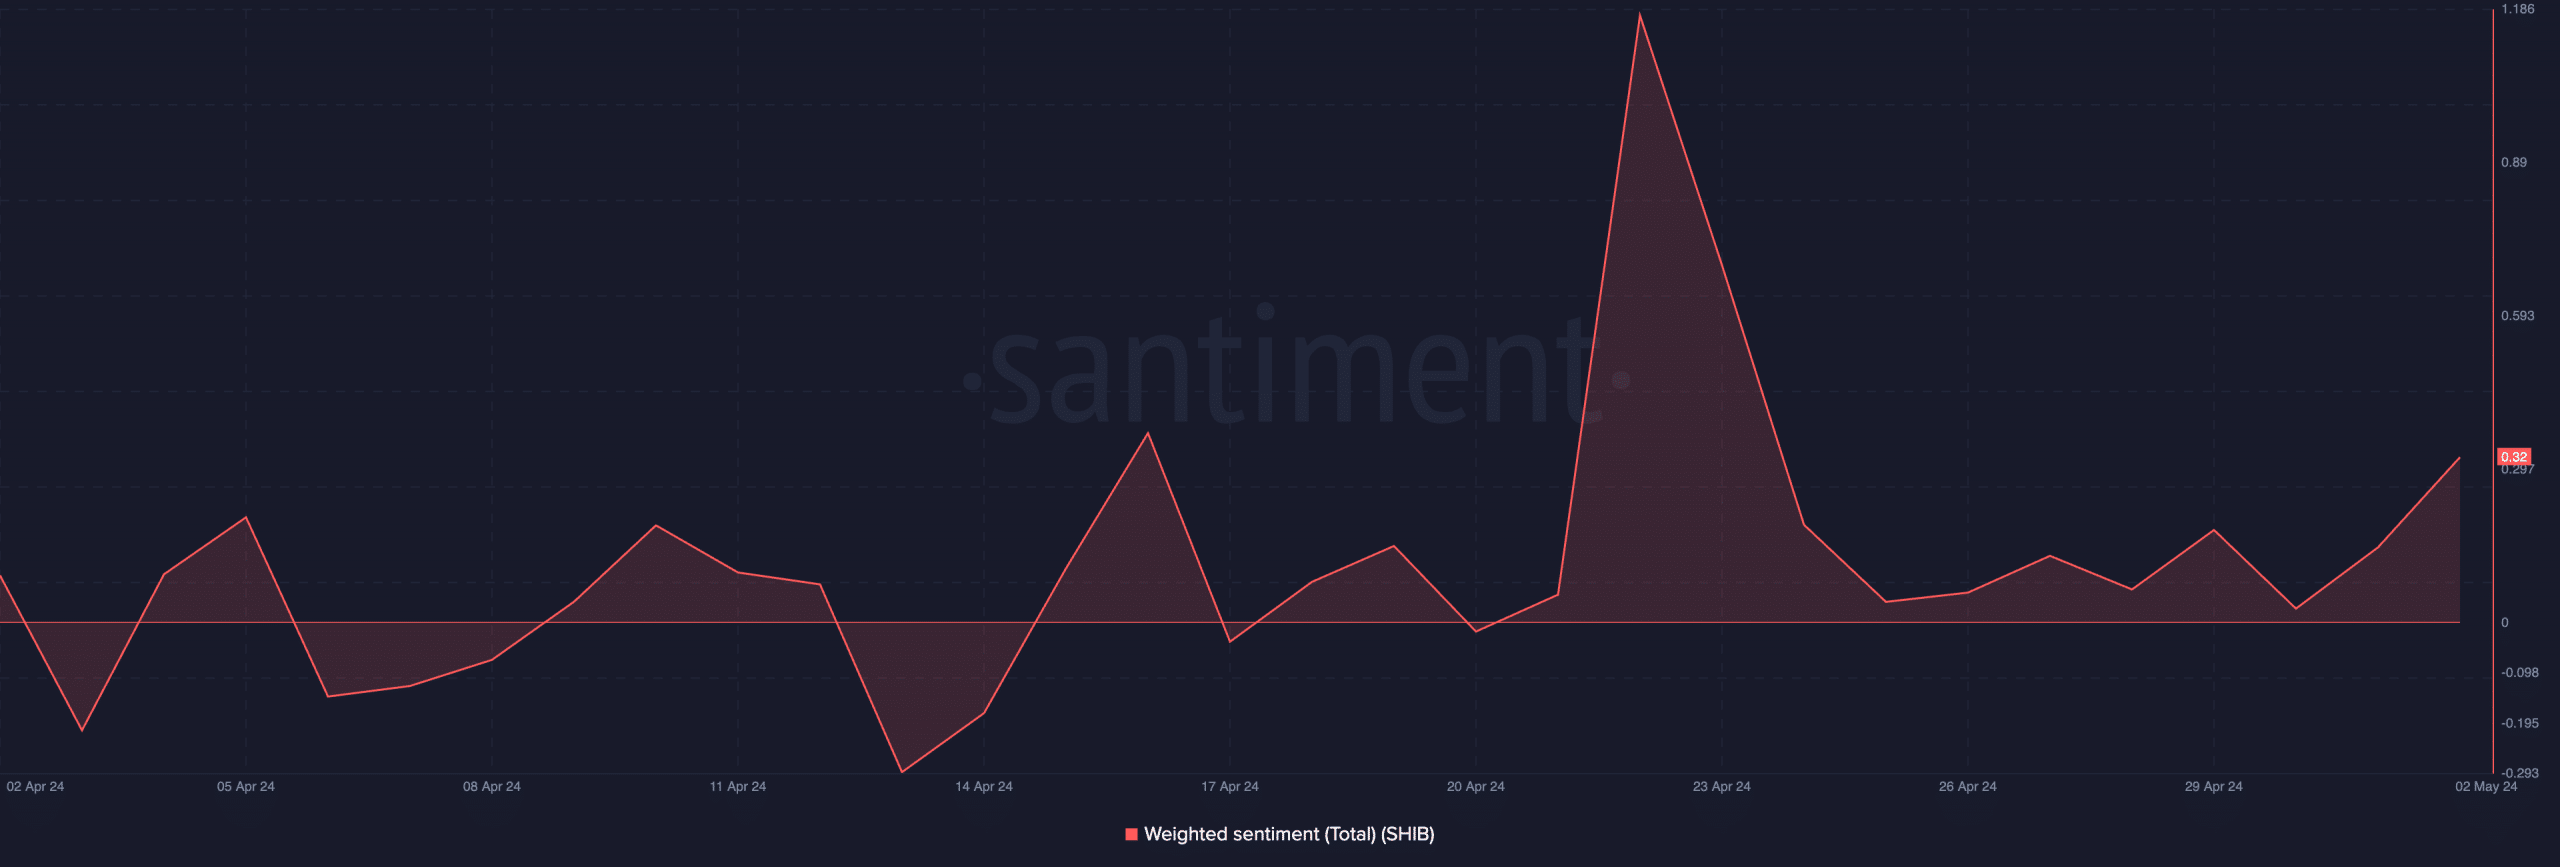 Source: Santiment
However, despite the decline in SHIB’s value, bullish sentiment among market participants has been re-emerging lately. The coin’s weighted sentiment, for instance, was positive at press time and has been so since 30 April.
If this bullish sentiment persists, SHIB’s price might break out of its current pattern in an uptrend to trade at $0.00003 on the charts.
Follow AMBCrypto on Google News
Previous: Explaining Toncoin’s [TON] 2x hike – Telegram, USDT, and Pantera
Next: Cardano TOPS this altcoin chart – Good news for ADA holders?
Read the Next Article
Cardano TOPS this altcoin chart - Good news for ADA holders?
2min Read
Cardano boasted the highest Nakamoto coefficient among all chains, suggesting greater decentralization.
 Himalay Patel
Journalist
Edited By: Jibin Mathew George
Posted: May 4, 2024
Share this article
- Cardano has the highest Nakamoto co-efficient among all chains, indicating higher levels of decentralization
- Sentiment around ADA remained unaffected though as prices fell
Over the past few months, there have been many areas where Cardano[ADA] has not been able to compete with other Layer 1s. However, there is one area where Cardano’s dominance has been unparalleled.
Will decentralization bring users to the yard?
According to recent findings, Cardano now has a higher Nakamoto co-efficient than the market’s other altcoins – A sign of high decentralization. The Nakamoto coefficient is a metric used to estimate the number of entities required to control 51% of a blockchain’s hashrate. A higher Nakamoto coefficient indicates a more decentralized network.
This means that the Cardano network cannot be influenced by a few large entities that dominate most of the network. A high Nakamoto coefficient can improve sentiment among crypto-enthusiasts and attract more users to the network.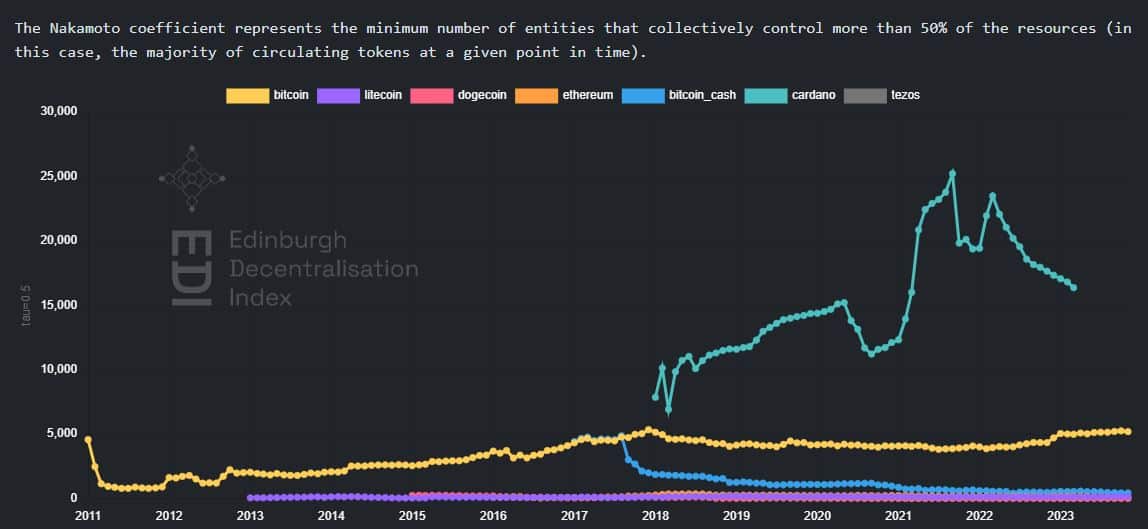 Source: EDI
However, the Nakamoto coefficient wasn’t enough to get addresses to buy ADA. Over the past week, for instance, the price of ADA fell by 3.82%. At the time of writing, it was trading at $0.4503. The crypto’s trading volumes fell by over 3.82% over the same period too.
Even though ADA addresses are holding the tokens of one of the most decentralized networks, most of them remain unprofitable. This was revealed by AMBCrypto’s analysis of Santiment’s data which indicated a negative MVRV ratio for the network. Moreover, the data also showed that the Long/Short difference has been declining – A sign that the number of long-term holders of ADA have been falling.
The prevalence of short-term holders could impact ADA negatively as these holders are much more prone to sell their holdings amidst market volatility.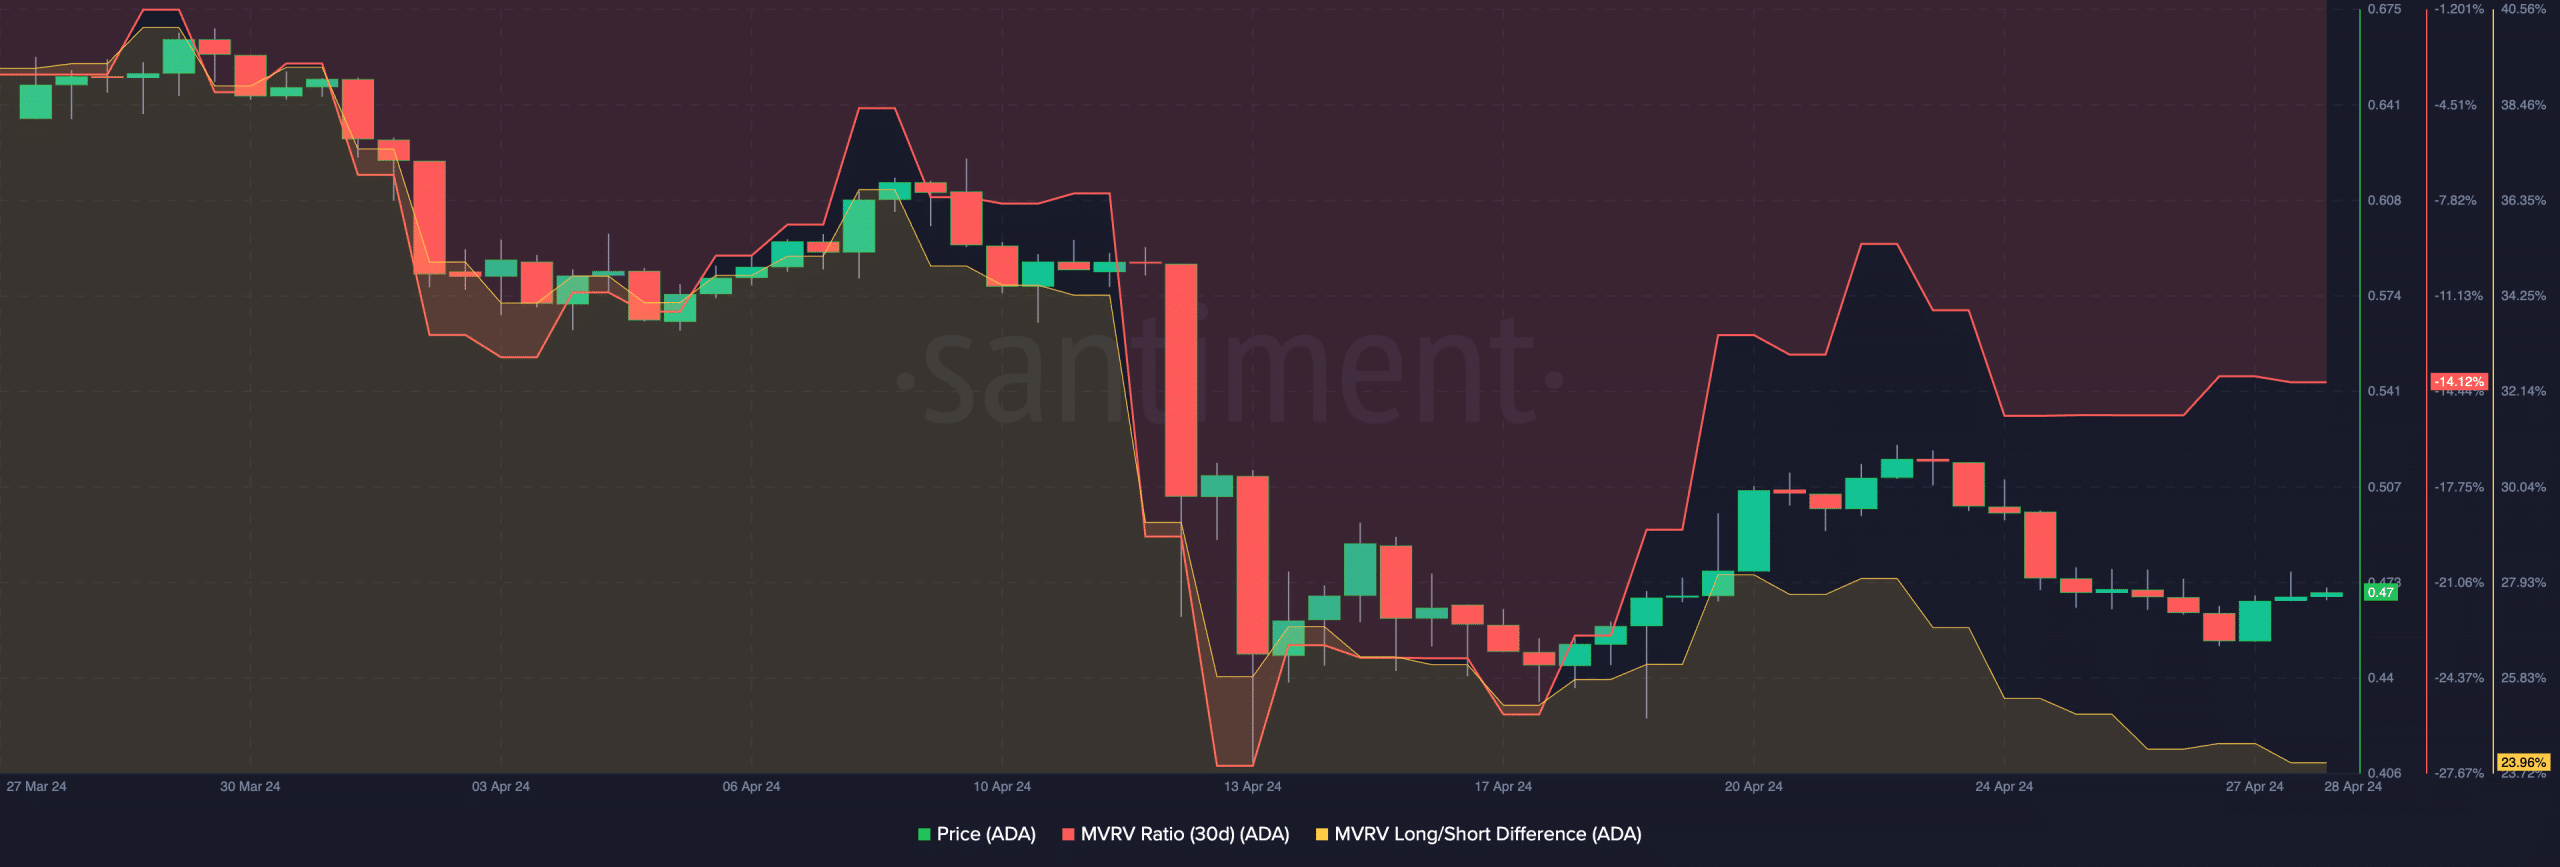 Source: Santiment
How are traders doing?
Bulls bore the brunt of these declining prices over the last few days. In fact, Coinglass data revealed that the number of longs liquidated grew significantly over the past week. In the last 24 hours alone, long liquidations for ADA amounted to $99,870.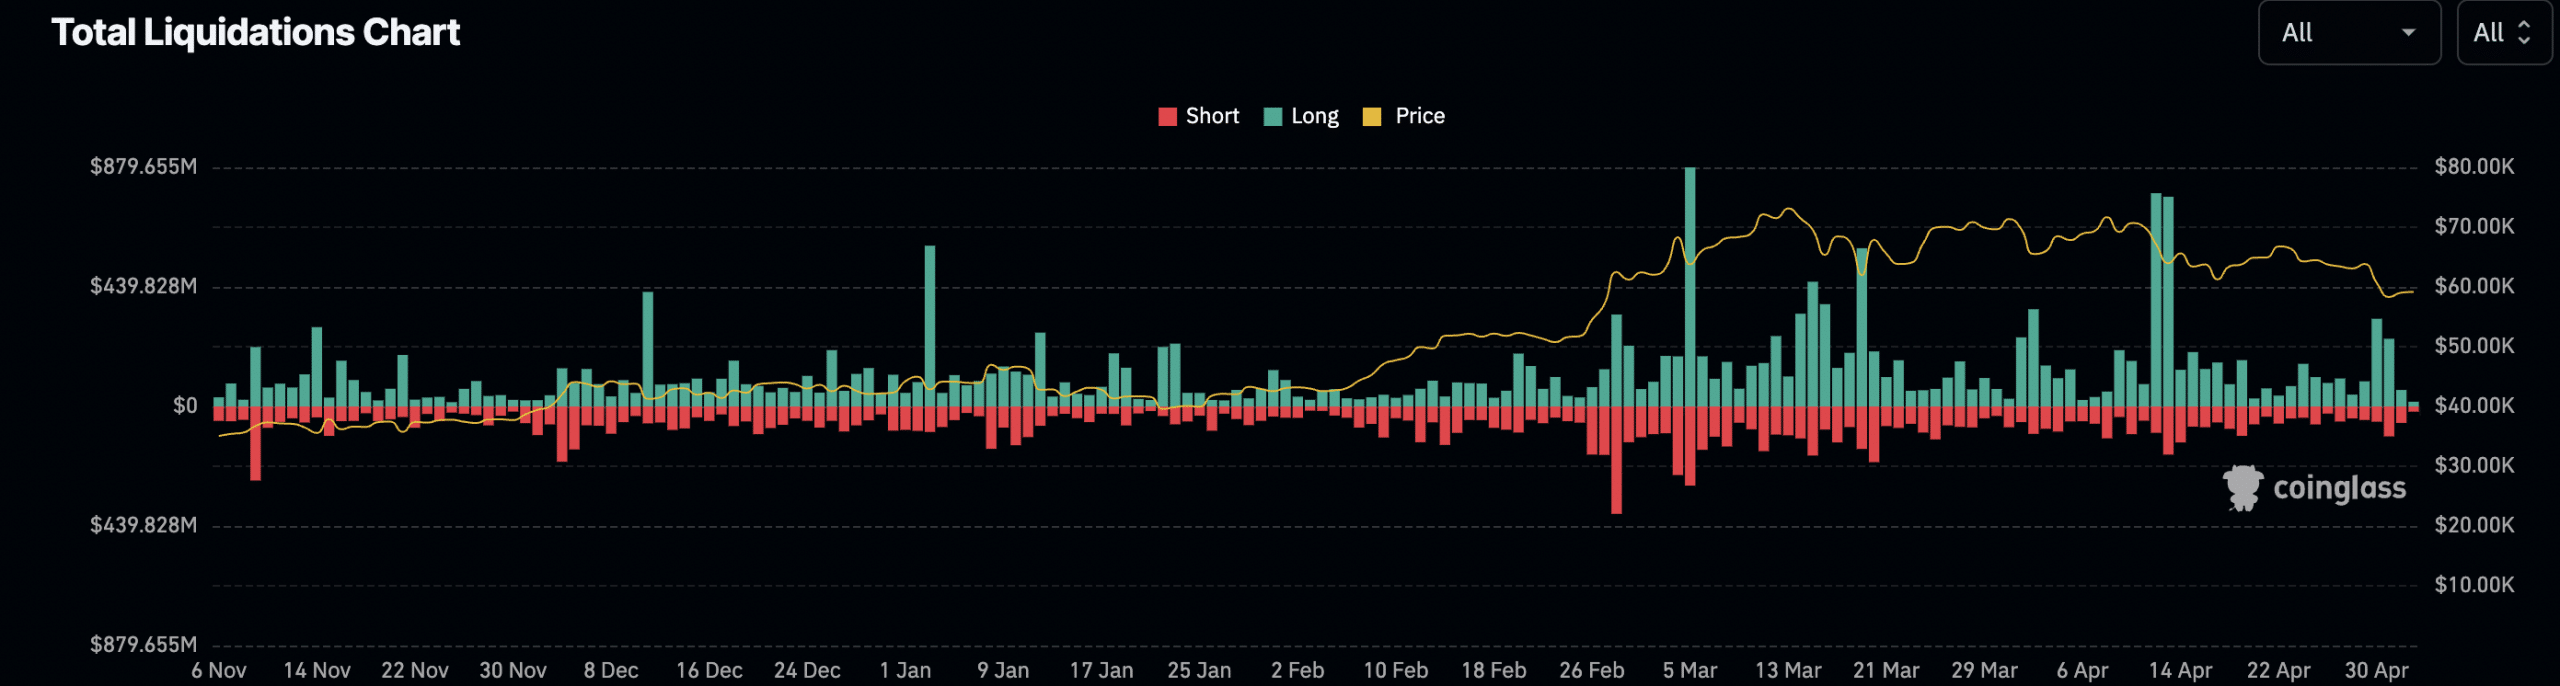 Source: Coinglass
Due to these factors, the sentiment around ADA turned skeptical. Most traders turned bearish over the last few days, which was reflected in the percentage of short positions against ADA growing.
Since 1 May, the percentage of short positions against ADA has grown from 49% to 53.8%.


