Ethereum’s Ripple effect – Toncoin flips Cardano to hit $7 ATH


The rise in the trading activity around Toncoin [TON], the cryptocurrency linked to the popular messaging app Telegram, has caused its market capitalization to surpass that of Cardan, CoinMarketCap’s data has shown.
As of this writing, TON traded at an all-time high. The altcoin exchanged hands at $7, logging a 36% price growth in the last seven days. In the past 24 hours, TON’s price rallied by 28%, and trading volume climbed by 578% during the same period. 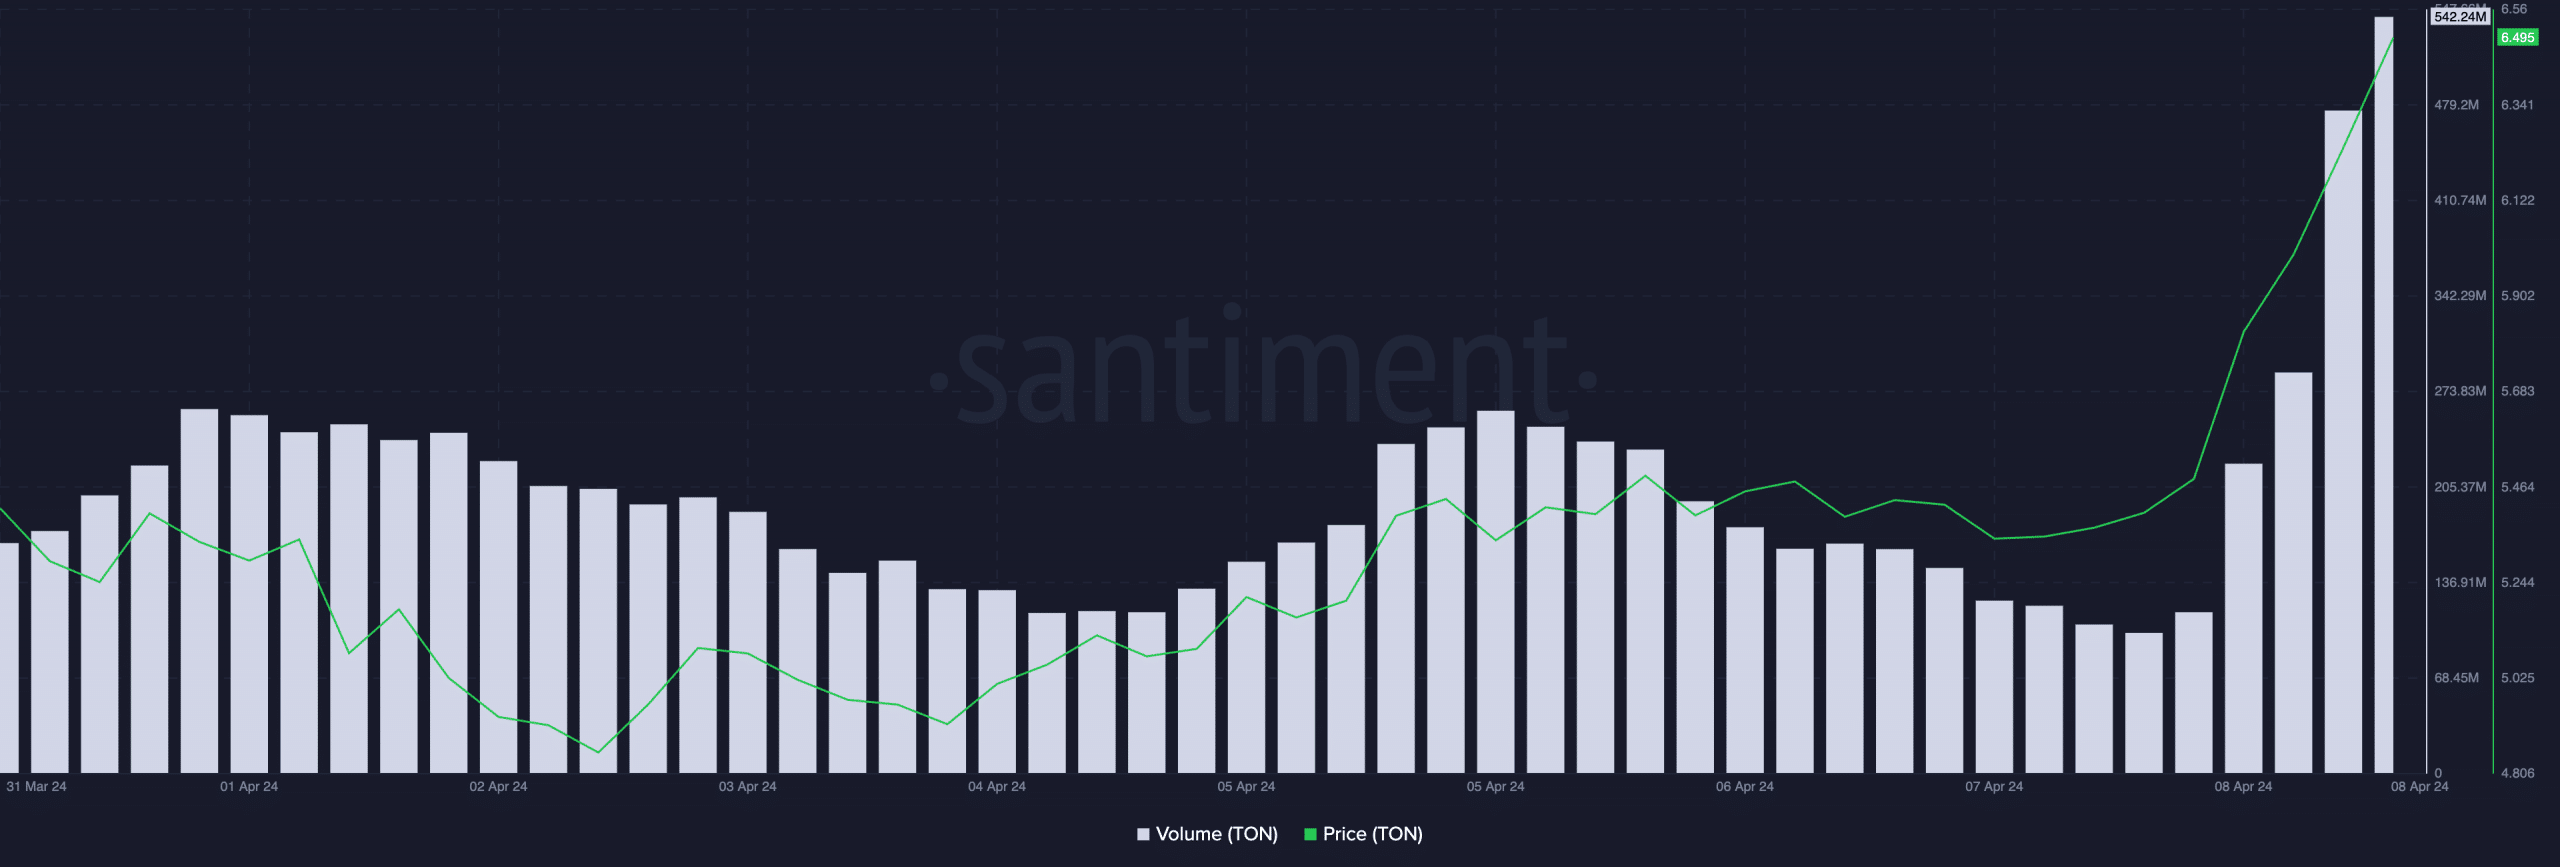 Source: Santiment
In a post on X, on-chain data provider Santiment noted that the rise in TON’s price and other ERC-20 assets in the last week is due to the surge in Ethereum’s [ETH] value. Per CoinMarketCap, the leading altcoin’s price has grown by 10% in the past seven days.
Will TON maintain this momentum in the short term?
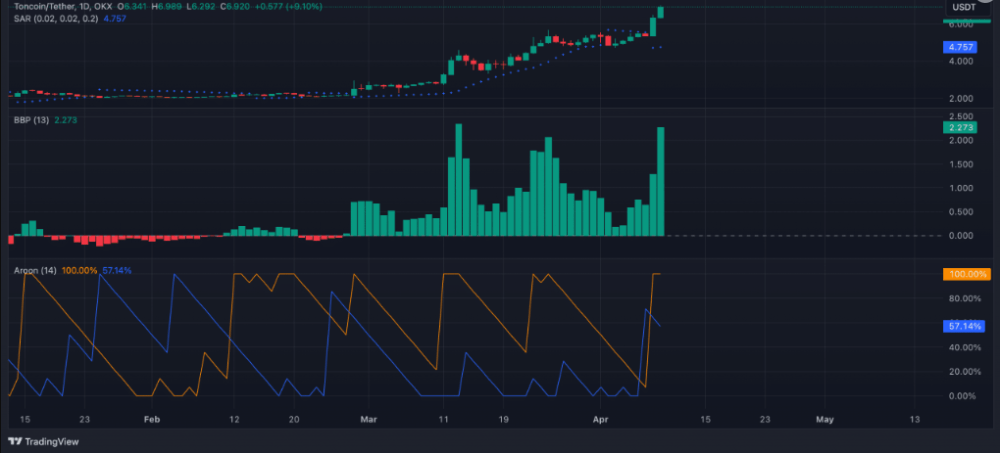
AMBCrypto assessed TON’s price movements on a 1-day chart and found that its key technical indicators hinted at the possibility of a sustained price rally.
For example, TON’s Aroon Up Line (orange) was spotted at 100% as of this writing. An asset’s Aroon indicator measures its trend strength and identifies potential reversal points.
When the value of its Aroon Up line is close to 100, it indicates that the uptrend is strong and that the most recent high was reached relatively recently.
Also confirming the bullish trend, TON’s Elder-Ray Index was positive. The indicator has posted only positive values since 28th February, despite the headwinds faced by the general cryptocurrency market in March.
The indicator estimates the relationship between the strength of buyers and sellers in the market. When its value is positive, it means that bull power dominates the market.
Further, the dotted lines that make up TON’s Parabolic SAR indicator rested below its price at press time.
After a brief stint above the altcoin’s price between the 2nd and 7th of April, these dots have flipped position to be below the altcoin’s price as of this writing.
This indicator measures the potential reversal points in an asset’s price direction. When its dotted lines rest under an asset’s price, it is a bullish signal. It confirms that an asset’s price will continue its uptrend. Traders interpret this as a sign to take long and exit short positions.