Solana hits May 2022 high; Is it all good news for SOL traders?

The recent upswing in activity on Solana has pushed its TVL to a new high.

- Solana’s TVL sits at its highest level in 22 months.
- Key technical indicator hints at the rise in bearish activity in the SOL market.
Solana’s [SOL] decentralized finance (DeFi) total value locked (TVL) has reached its highest level since May 2022, according to DefiLlama’s data.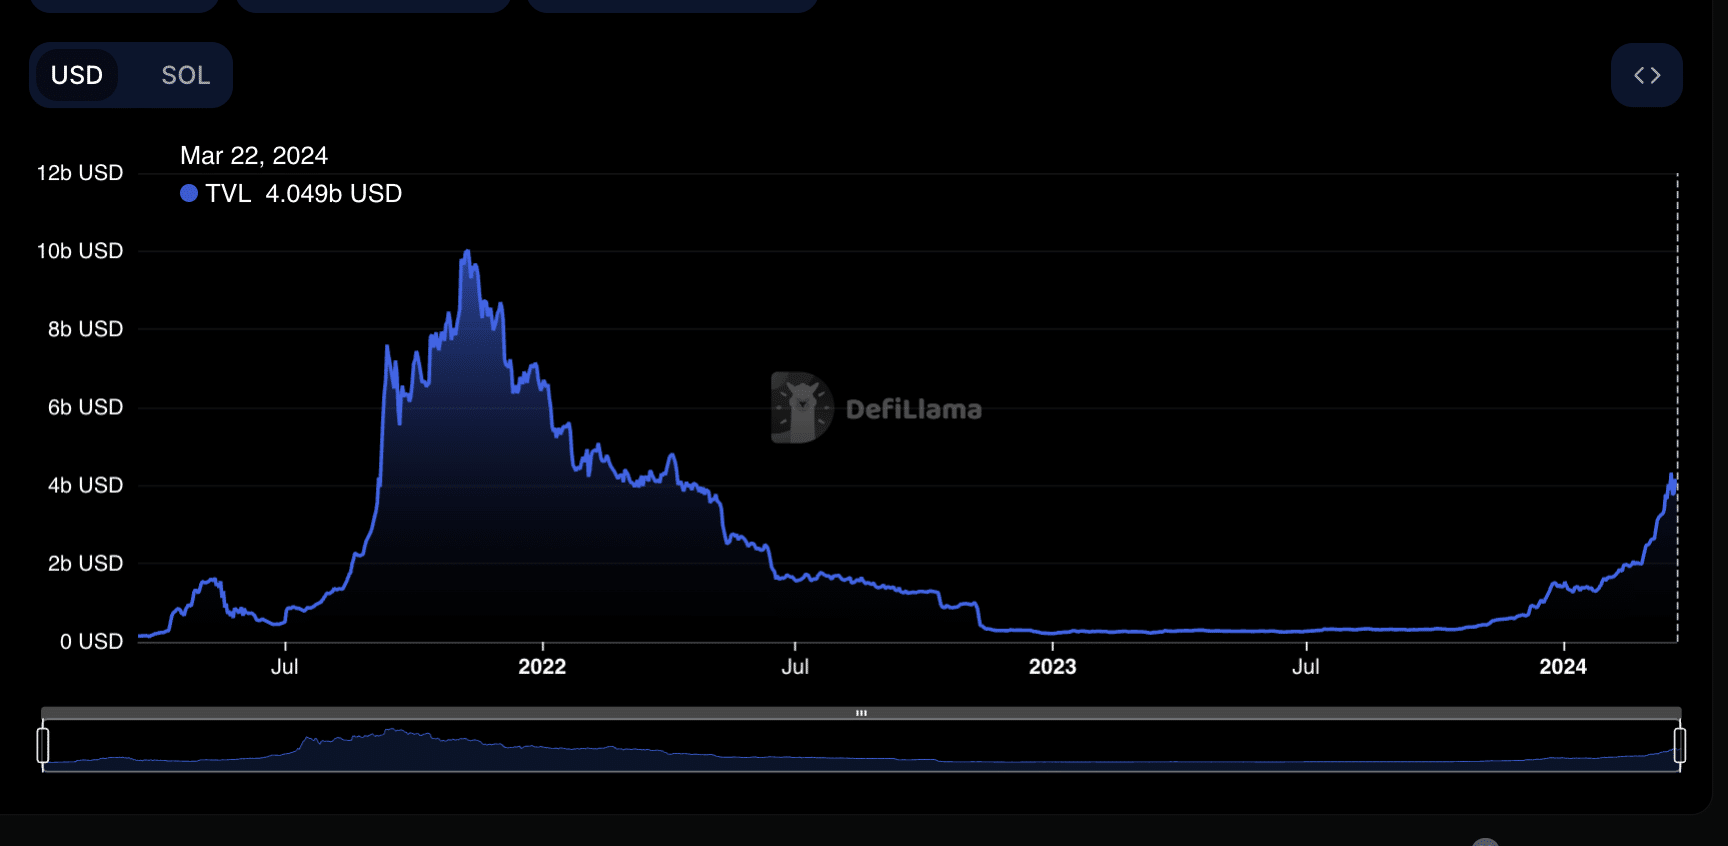 Source: DefiLlama
At press time, the Layer 1 (L1) network’s TVL was $4.03 billion, having risen by 97% in 30 days. According to DefiLlama’s ranking, Solana is the only blockchain amongst the top 10 DeFi networks that its TVL has risen by this much in the last 30 days.
Rise in user demand for Solana
The surge in Solana’s TVL is attributed to a recent uptick in user activity on the network.
According to The Block’s data dashboard, the monthly count of new addresses on Solana has risen to an all-time high. In the past 21 days, the number of unique first signers to transact in the Solana Network has totaled 16.32 million.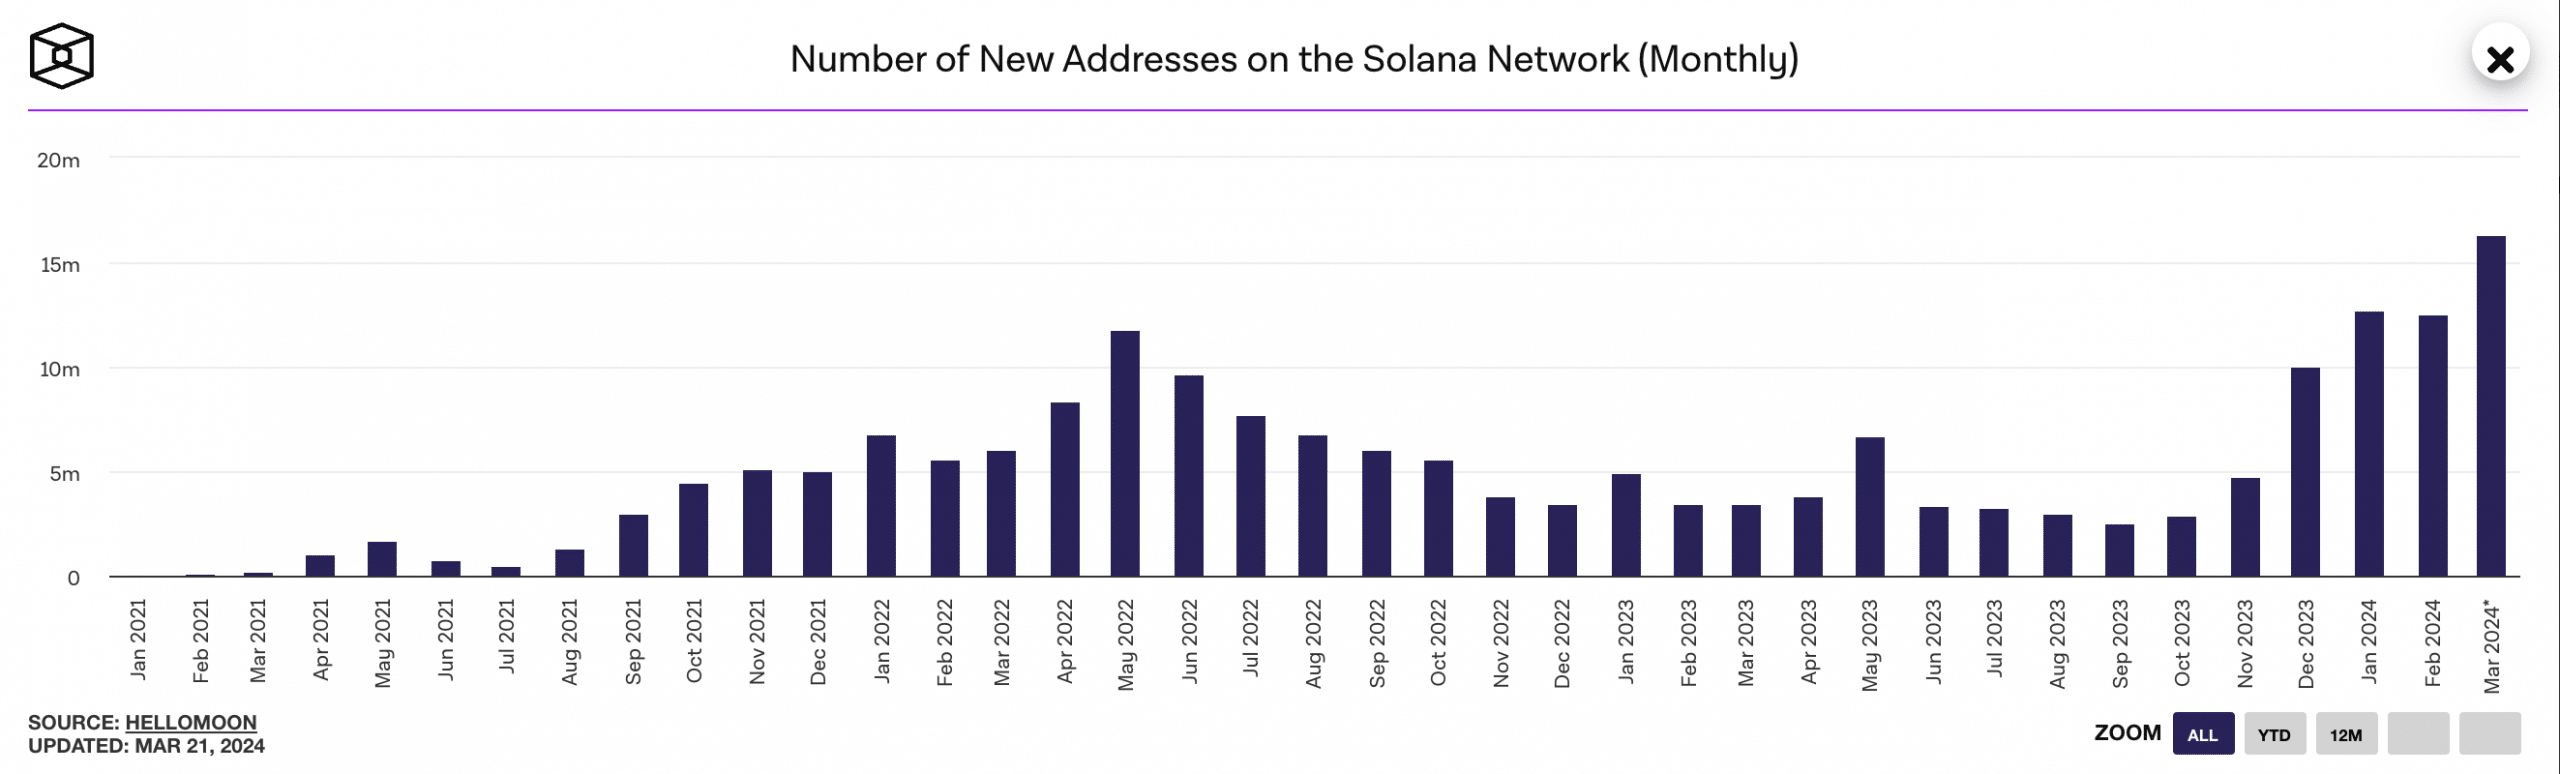 Source: The Block
Further, the month so far has been marked by a significant uptick in active address count. AMBCrypto found that this has amounted to 22.19 million, representing Solana’s highest since July 2022.
Due to the rise in user activity on the chain, the total amount of transaction fees paid on Solana climbed to a multi-month high of $5.08 million on 18th March.
DefiLlama’s data showed that on that day, protocol revenue derived from transaction fees rose to an all-time high of $2.5 million.
SOL demand trickles in but bearish sentiments rise
SOL exchanged hands at $179 at press time, according to CoinMarketCap’s data. Although impacted by the general market decline in the past week, the demand for SOL continues to outpace coin sell-offs among spot market participants.
AMBCrypto’s readings of the coin’s key momentum indicators showed that they were positioned above their neutral lines at press time.
For example, SOL’s Relative Strength Index (RSI) and Money Flow Index (MFI) were 61.19 and 80.74, respectively. These values showed that daily traders favored SOL accumulation over distribution.
Further, the coin’s positive Chaikin Money Flow (CMF) value indicated an inflow of liquidity into the SOL market. As of this writing, SOL’s CMF was 0.16.
How much are 1,10,100 SOLs worth today?
However, despite this, SOL’s Parabolic SAR (Stop and Reverse) indicator hinted at the steady rise in bearish activity, mirroring the decline in bullish sentiment in the general market.
This indicator identifies potential trend direction and reversals. When its dotted lines rest above an asset’s price, traders take it as a signal to exit long positions or initiate short positions.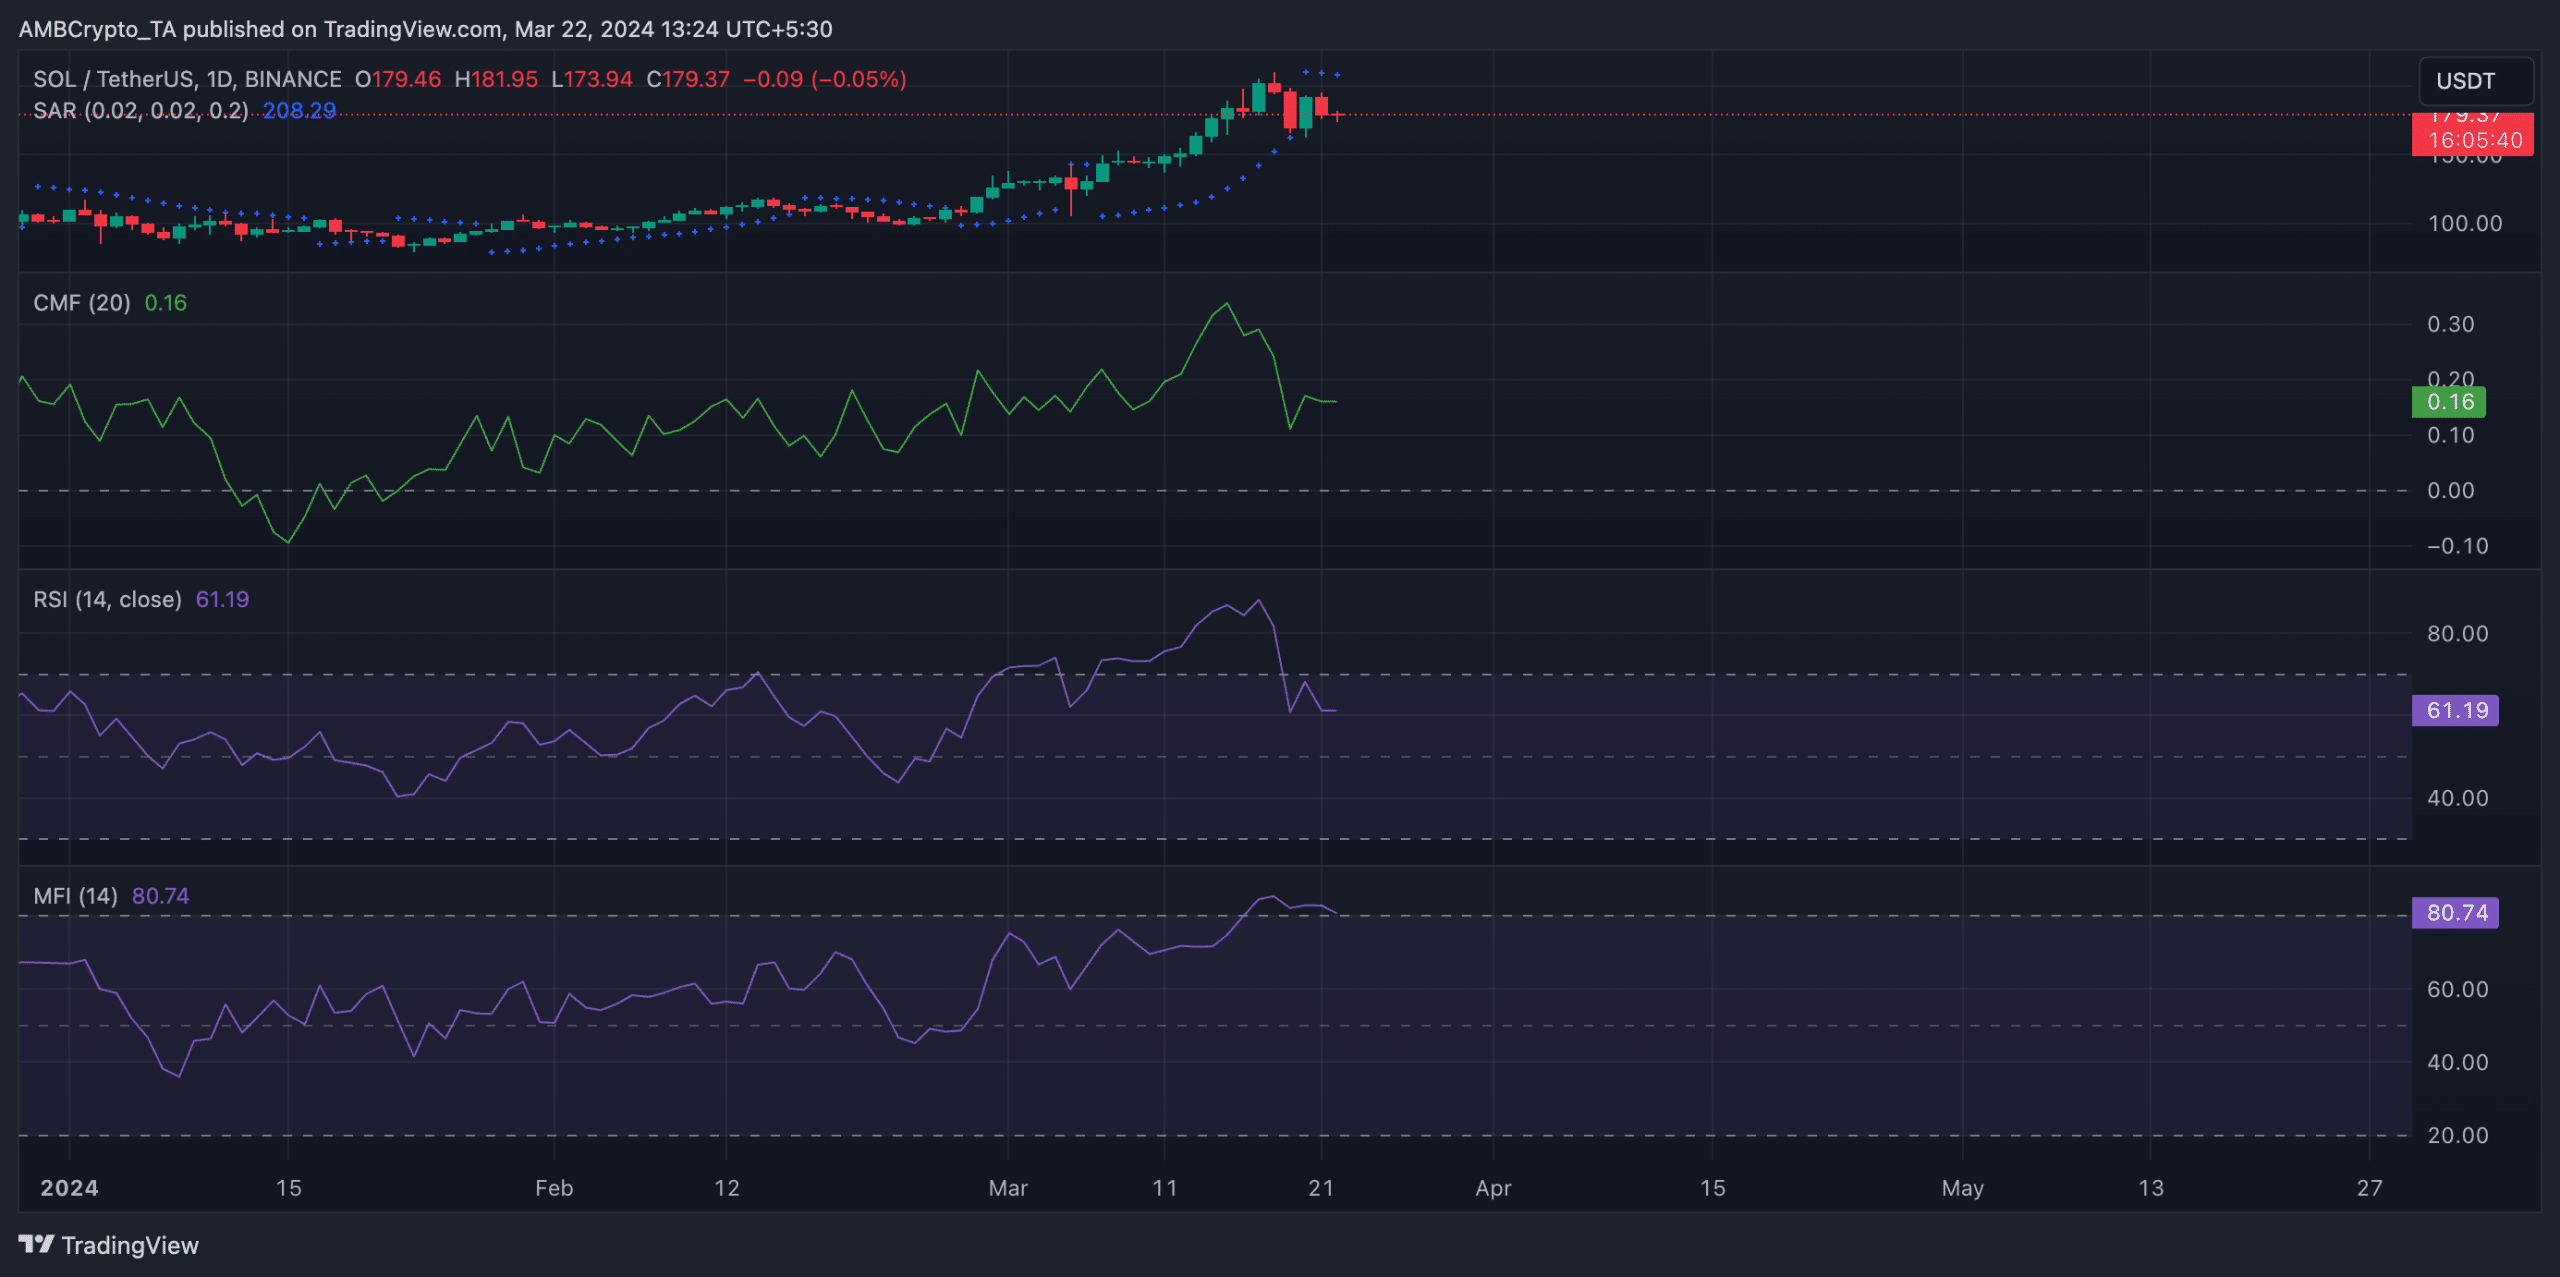
After Solana, can memecoins rescue AVAX's price now?
2min Read
Stablecoin activity surged significantly on the Avalanche network. Are memecoins the reason?

- Stablecoin activity on the network soared.
- Price of AVAX grew, however, interest in Avalanche NFTs declined.
Avalanche [AVAX] has been trying to mark its territory in the competitive altcoin space for quite some time. However, it has not been able to gain as much traction as its counterparts.
Surge in stablecoin volume
Recent data indicated that the tides were turning in Avalanche’s favor. Avalanche observed the highest level of stablecoin activity recorded since 2023. This indicated more activity and liquidity present on the network.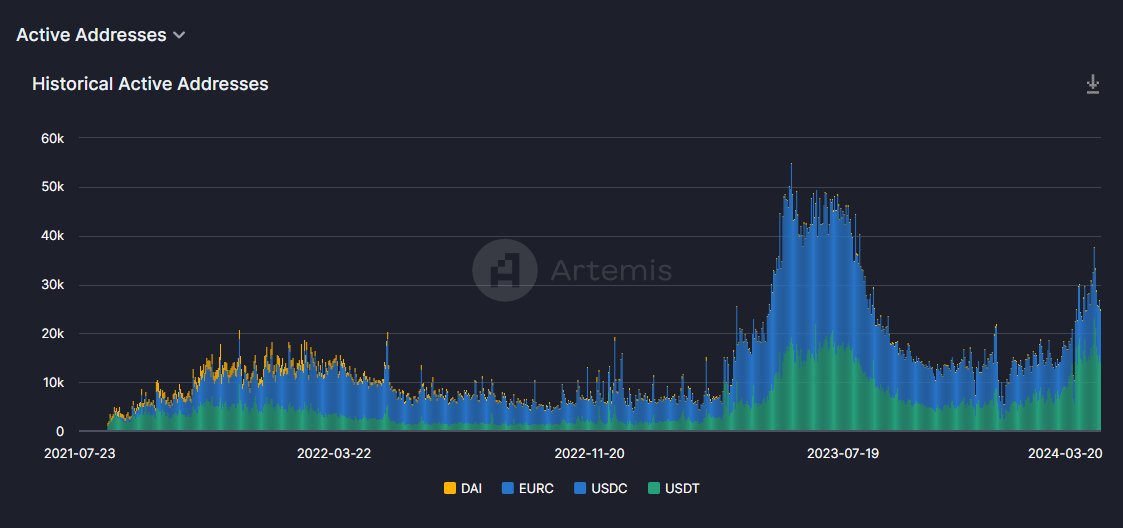 One of the reasons for the rise in stablecoin volume would be the growing number of memecoins gaining popularity on the Avalanche network.
Unlike other networks such as Solana, the memecoins on the network are being backed by institutions such as the Avalanche Foundation.
The recent memecoin rush program launched by the Avalanche Foundation aims to attract more users to the Avalanche network through memecoins and also aid in adding more liquidity to their ecosystems.
If the bet made by the Avalanche Foundation pans out, the network could see further growth both in terms of its ecosystem and price.
NFT interest declines
However, coming to other aspects of the Avalanche ecosystem, it was seen that interest in its NFT sector had declined. Blue chip Avalanche NFT collections such as LoFi leopards and Chad Doge witnessed a decline in terms of volume.
Moreover, the amount of new NFTs being minted on the Avalanche network had also declined.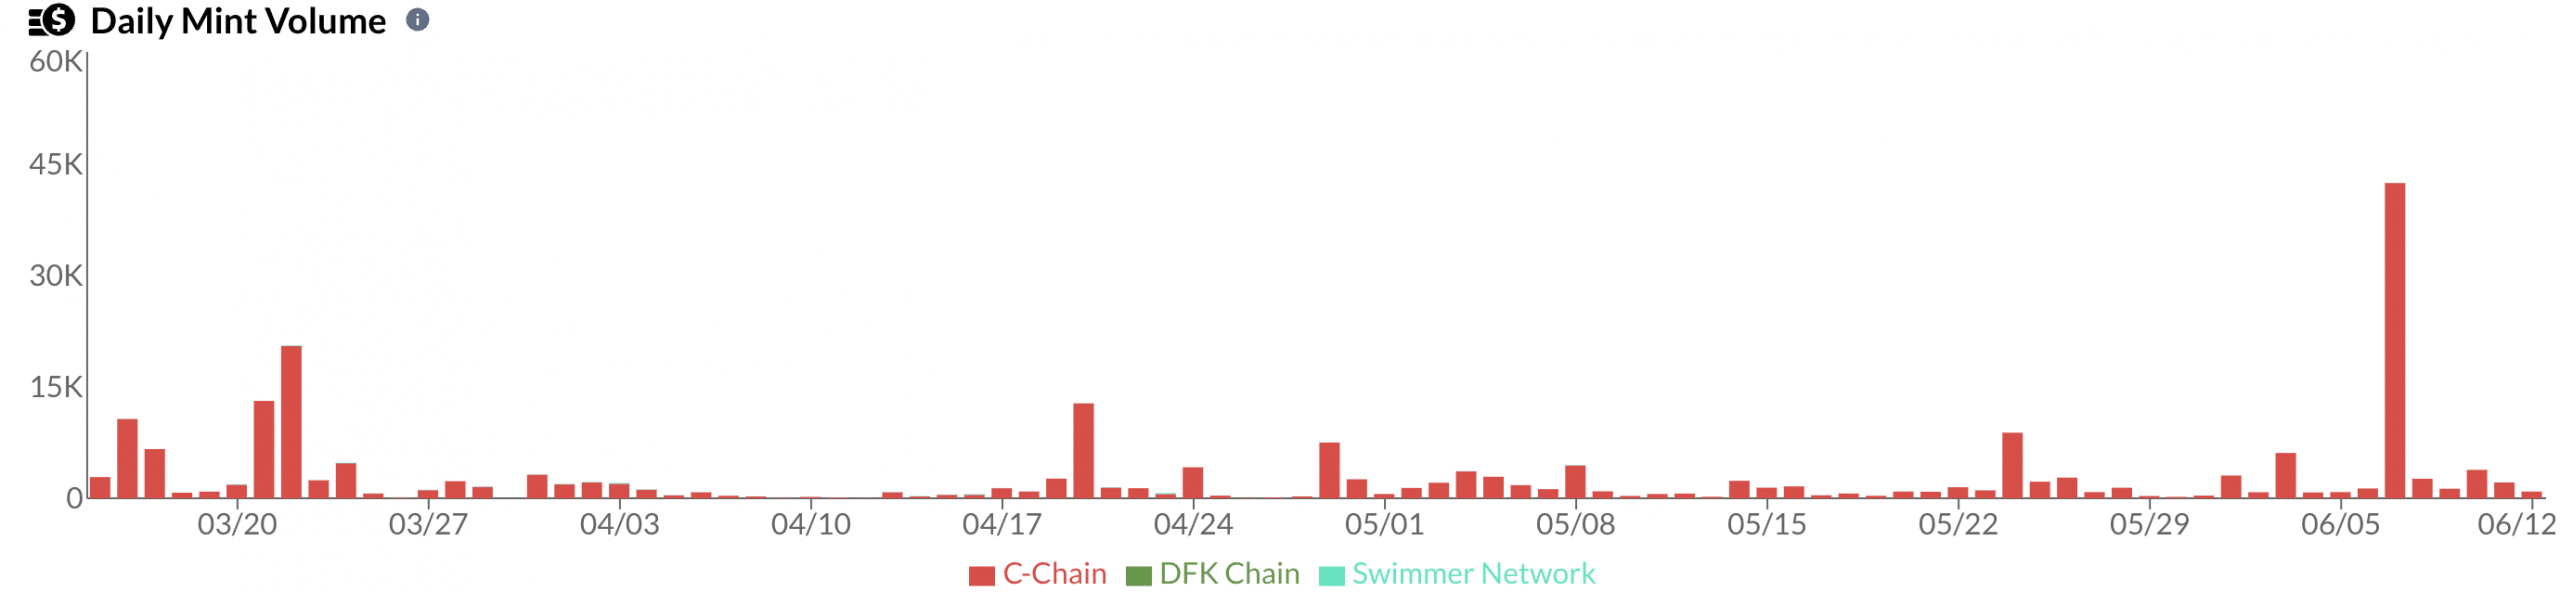 Source: AVAXNFTStats
Despite the decline in NFT interest, AVAX’s price was doing relatively well. At press time, AVAX was trading at $56.09 and its price had grown by 1.29% in the last 24 hours.
The price of AVAX has been growing for quite some time. After the 12th of March, the price of AVAX rallied by 14% while exhibiting multiple higher highs and higher lows, establishing a bullish trend.
After testing the resistance level of $65.39, the price of AVAX retraced to $50.84. Despite the dramatic correction, the decline in price wasn’t significant enough for a trend reversal. If the price of AVAX re-tests the $57.04 level, it may rally again in the future.
Realistic or not, here’s AVAX market cap in BTC’s terms
The OBV(On Balance Volume) of AVAX also grew along with the price implying an increased buying pressure for AVAX.
However, the CMF(Chaikin Money Flow) of AVAX fell which could mean that AVAX’s ride to the top won’t be very smooth.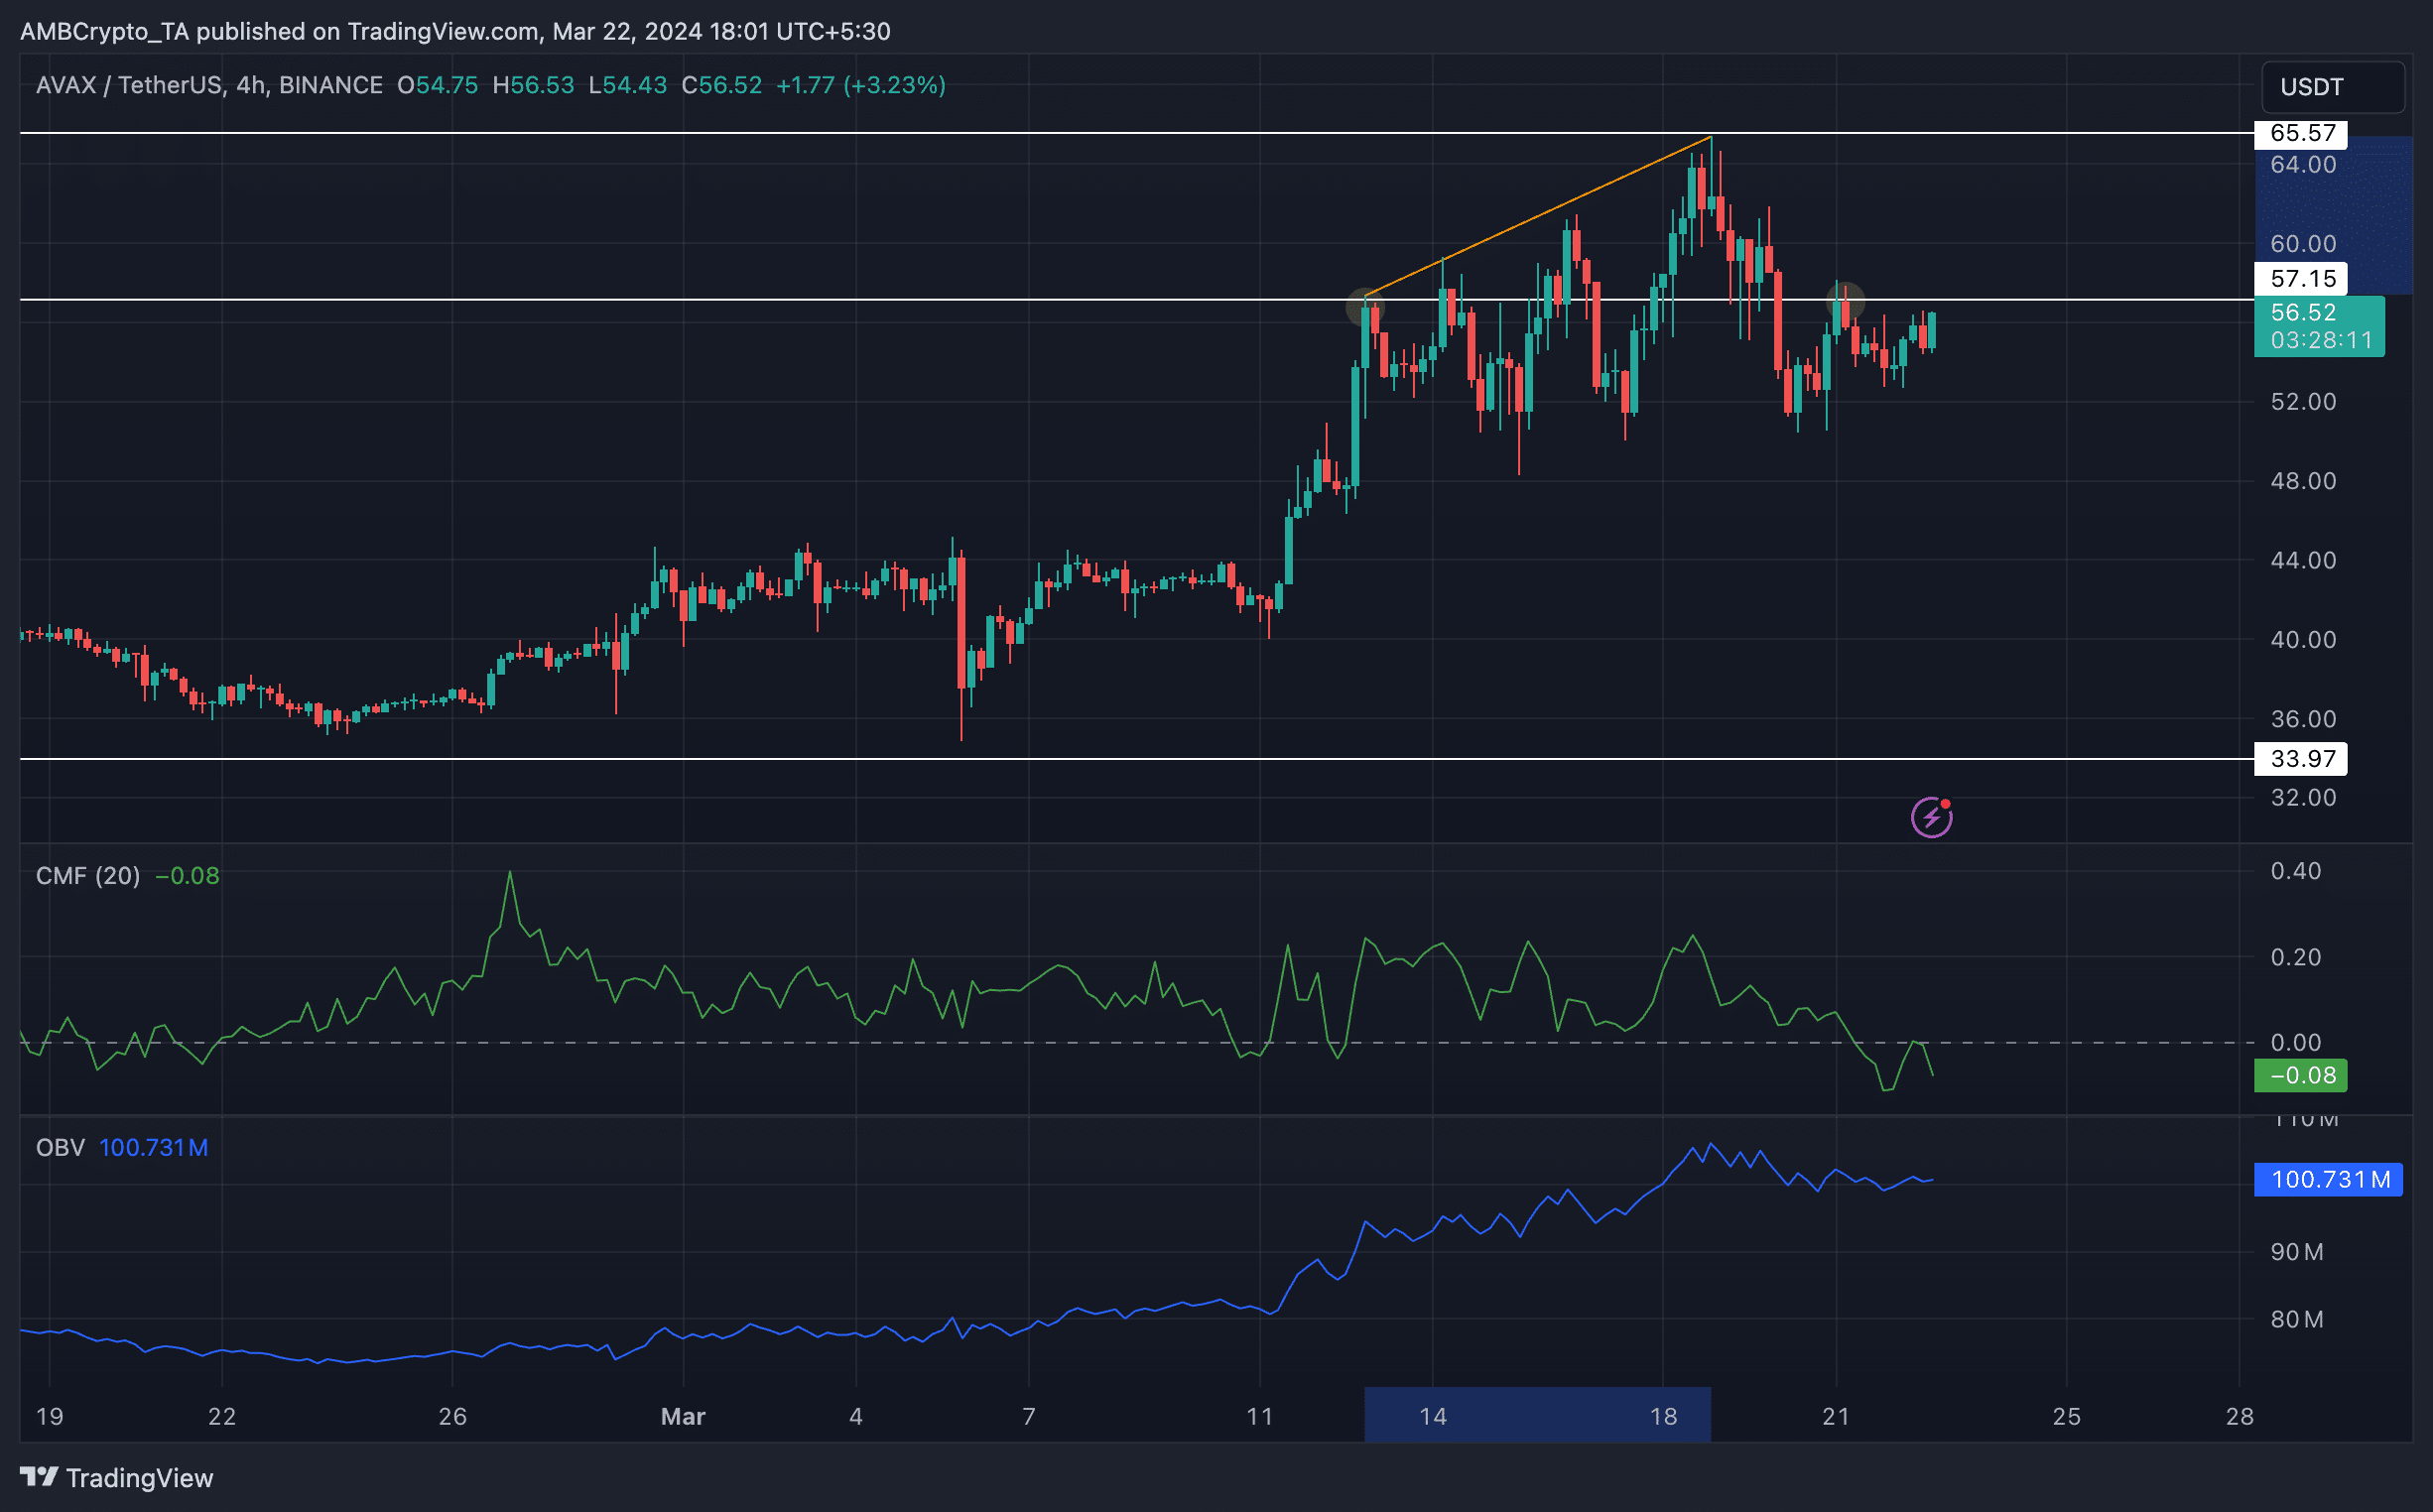
WIF's 18% drop: Identifying if the price bubble is popping now
2min Read
A key indicator reveals how capital has started to flow back into the cryptocurrency.

- WIF has become less popular after erasing a sizable part of its gains.
- Price analysis showed that the token might gain 33.54% if money flow increases.
Dogwifhat [WIF] posted one of the heaviest losses as the price plummeted by 18.12% in the last seven days. At press time, WIF exchanged hands at $2.25, proof that it had erased a chunk of its gains despite hitting $3.50 one week ago.
WIF’s decline could be linked to intense selling pressure considering the kind of upswing the memecoin had earlier. Another reason the value declined could be connected to capital rotation in the market.
Previously, a lot of liquidity went into memecoins. But after the tokens produced incredible gains, traders booked profits.
Furthermore, many are looking away, and finding the next narrative or token that can deliver a mind-blowing uptrend within a short time. Considering the kind of volume WIF had at press time, it does not look like it is one of the options.
It does not have the buzz anymore
According to AMBCrypto’s on-chain analysis using Santiment, WIF’s volume was down to 345.73 million. On the 15th of March, this same metric was 1.26 billion.
A decrease like this was evidence of waning interest in the token. If the volume continues to decrease, the price might also drop below $2.25. However, a rebound might be likely if WIF’s selling pressure gets too much.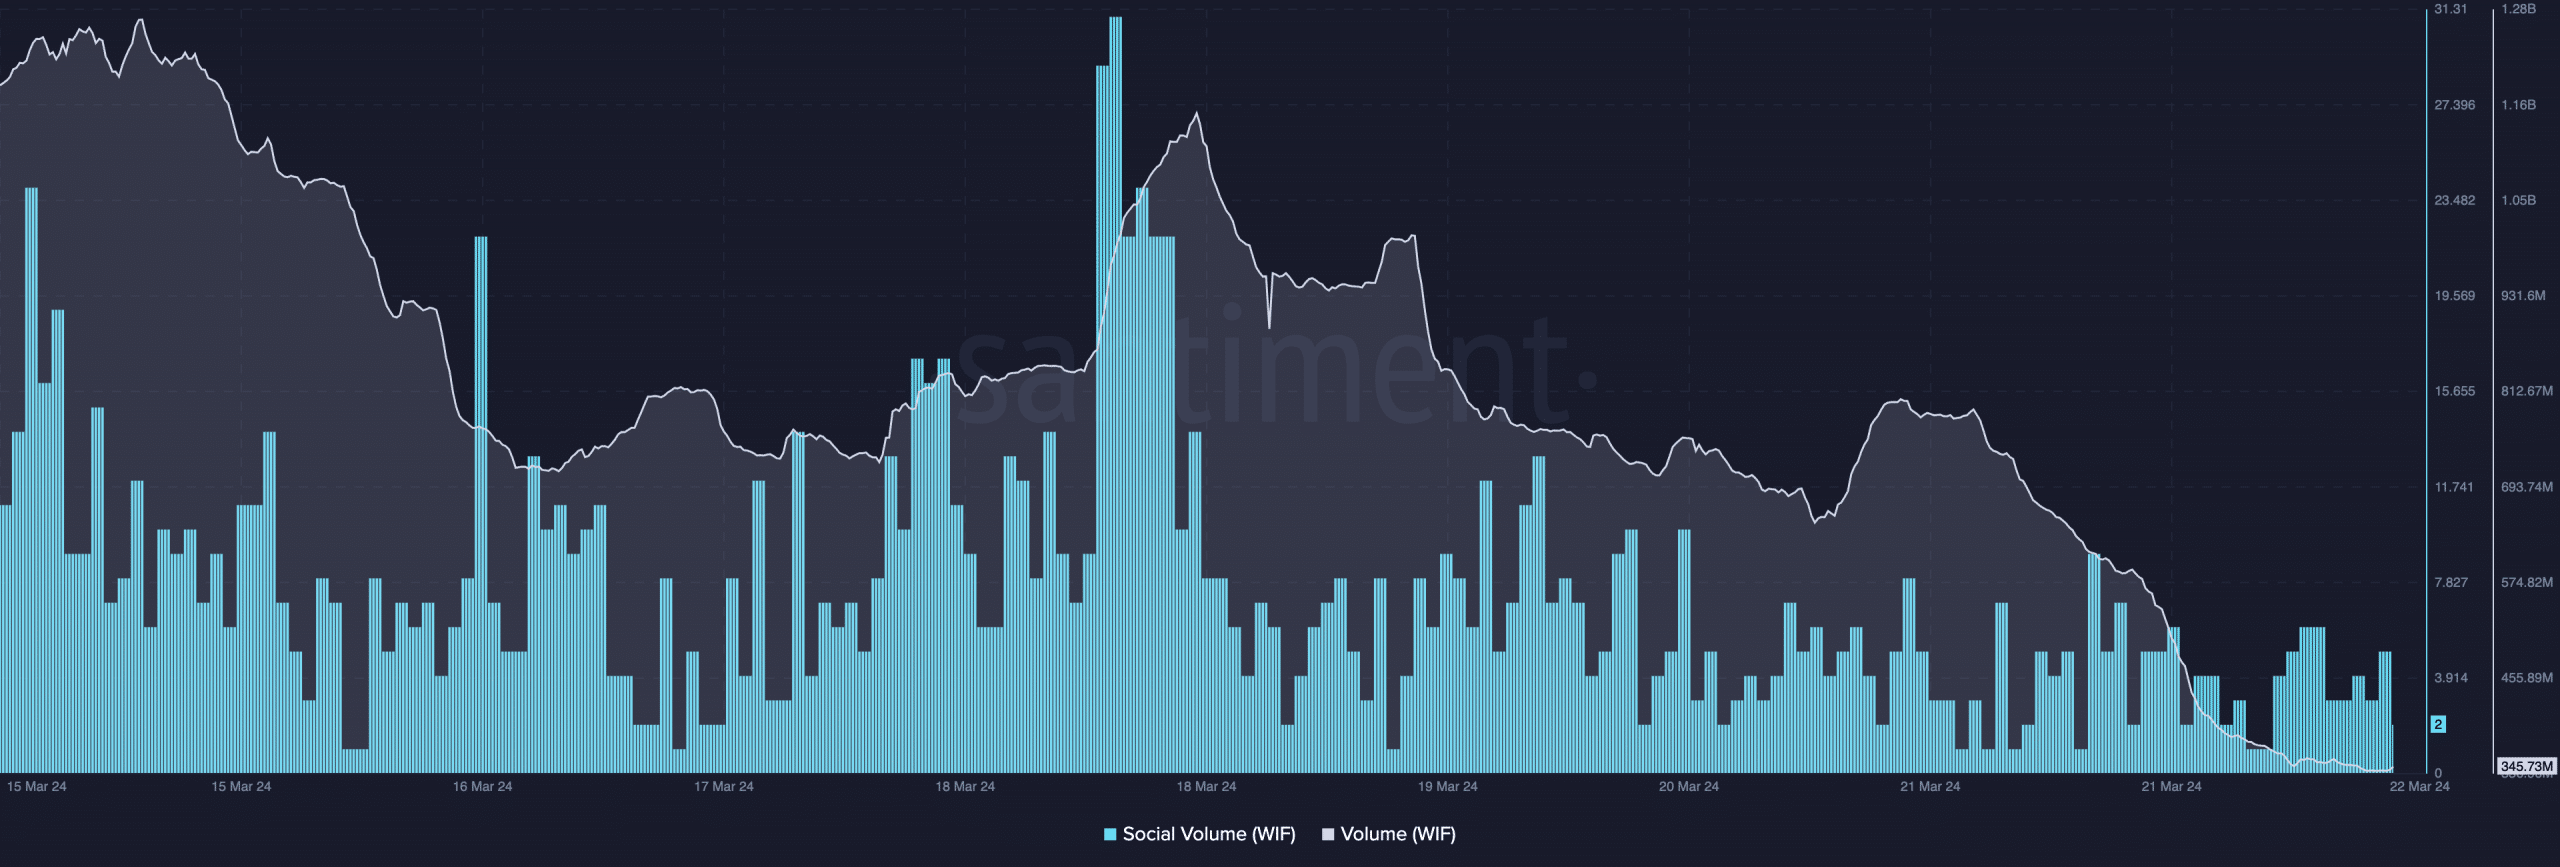 Source: Santiment
Beyond the confines of the price, we looked at the social data around the token. At press time, dogwifhat’s social volume had fallen compared to the heights it reached a few days back.
For those unaccustomed to the ins and outs of the market, social volume considers search terms and documents related to a cryptocurrency. Therefore, the decrease in the metric implied that the token had become less popular among market participants.
GoogleTrends also corroborated this data. As of the 17th of March, WIF’s GoogeTrends score was 100. But at press time, the reading had decreased to 42.
WIF is not here to bite the dust
From a technical perspective, bulls might find an underlying support at $2.24. But this has not been validated yet. However, if buying pressure comes in at this point, WIF’s price might try to retest $2.90.
However, the attempt might not be smooth considering the overhead resistance at $2.60. If bears reject the attempt, WIF might experience a 27.79% decrease to $1.87.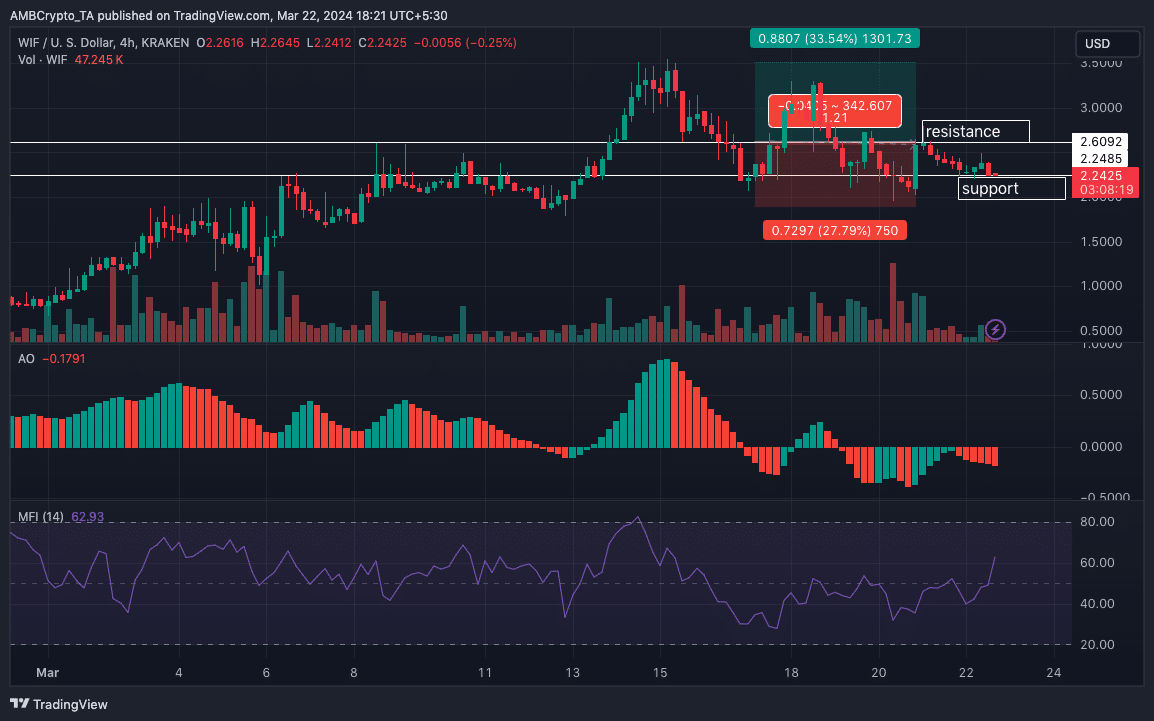 Source: TradingView
On the other hand, a successful break through the resistance could drive a 33.54% hike which could place WIF at $3.49. As of this writing, the Awesome Oscillator (AO) was negative, indicating increasing downward momentum.
Is your portfolio green? Check the dogwifhat Profit Calculator
But the Money Flow Index (MFI) resumed upwards. This increase in the MFI reading was a sign that capital had begun to flow into WIF gain.
Should the flow continue to increase, other indicators might align, and WIF’s price might be able to reverse the bearish trend.
Previous: After Solana, can memecoins rescue AVAX’s price now?
Next: Bitcoin: Small holders are hoarding; BTC to $70K again?
Bitcoin: Small holders are hoarding; BTC to $70K again?
As prices soared, smaller Bitcoin addresses initiated the accumulation of BTC.
- Relatively smaller Bitcoin addresses begin to accumulate BTC as prices surge.
- Profitability remained low, reducing the chances of sell-offs anytime soon.
Ever since Bitcoin[BTC] has passed the $70,000 mark and then witnessed a correction, speculation around what will happen next to the coin has flooded the crypto sphere.
Crabs and Fishes take the pie
The price of Bitcoin may rally due to the behavior of two distinct groups of holders known as “crabs” and “fishes.” These terms refer to holders with Bitcoin holdings ranging from 1 to 10 BTC for crabs and 10 to 100 BTC for fishes.
Recent observations suggest a potential regime change among these holders, transitioning from a phase of distribution to accumulation.
Both crabs and fishes have experienced the highest level of accumulation since November 2023. Moreover, there are indications that even smaller holders, with holdings of 0 to 1 BTC, are joining this accumulation trend, as evidenced by recent data.
While this accumulation broadens the investor base, it also concentrates holdings among these mid-tier investors, which could lead to more centralized control over the market compared to a scenario with a wider distribution of smaller holdings controlled primarily by whales.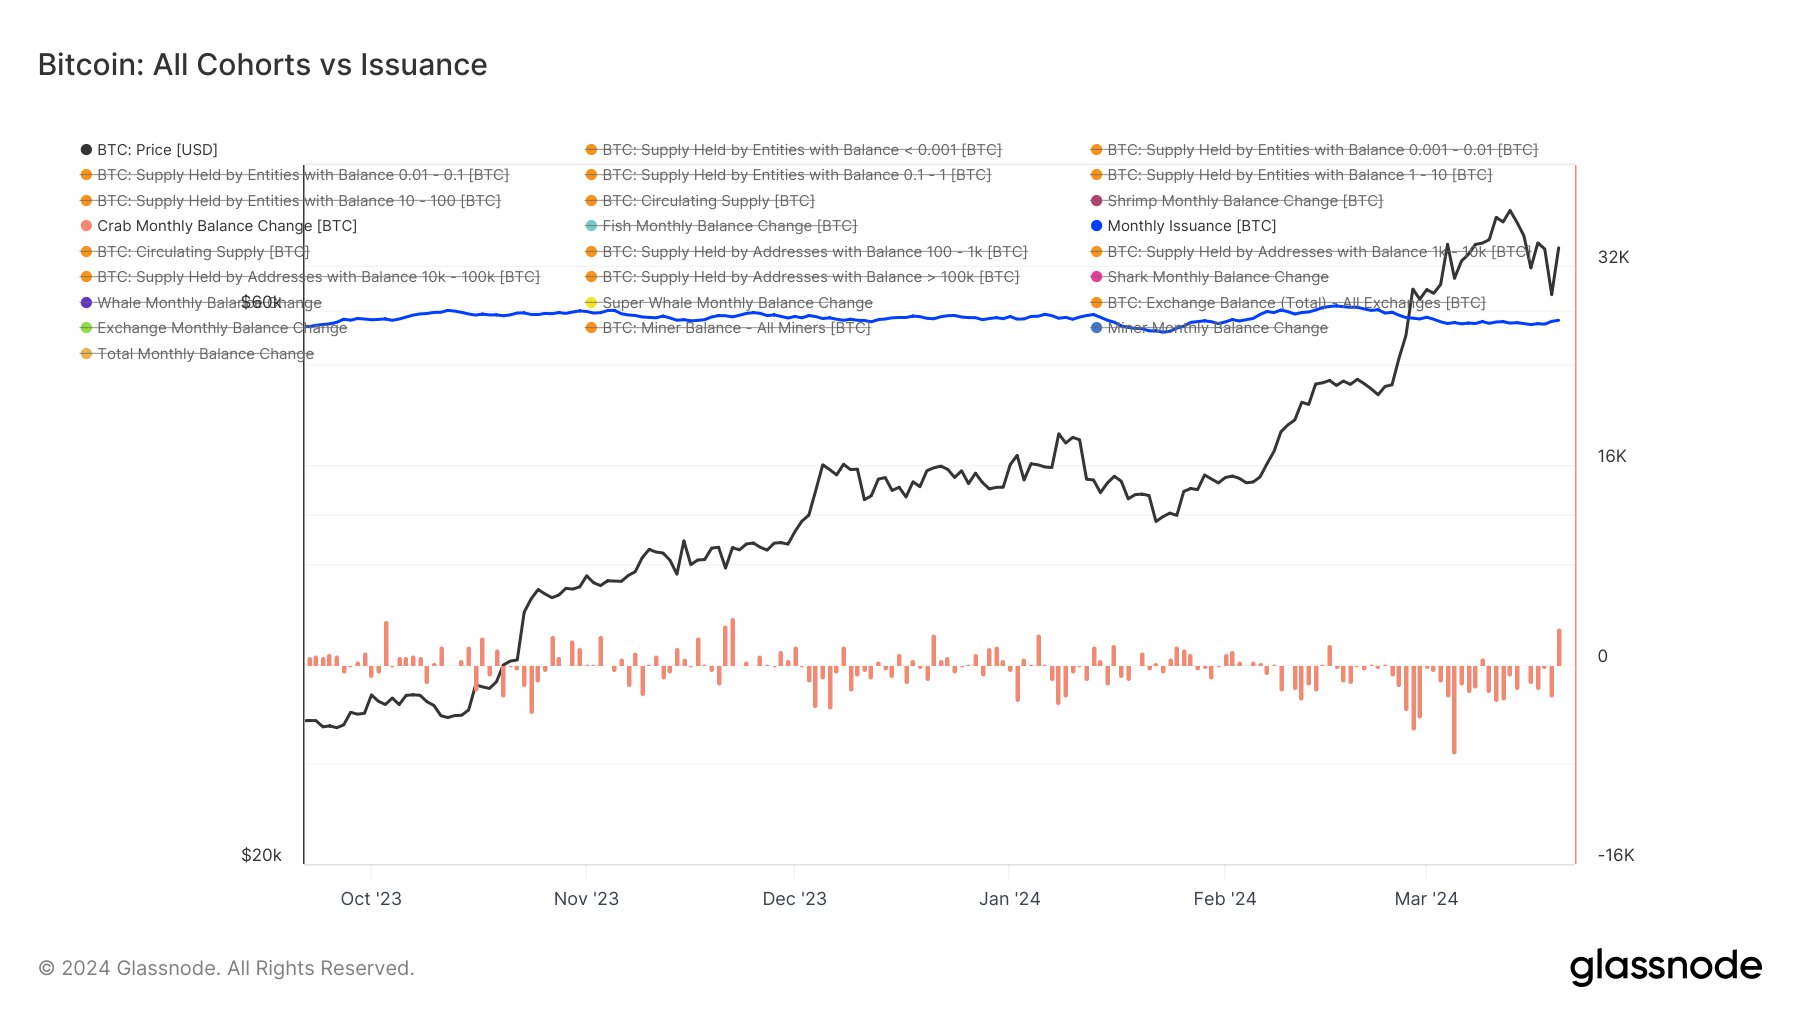 Source: X
Some challenges ahead
However, key metrics indicated that the market had potentially overheated, as evidenced by the Bull-Bear Market Cycle Indicator. It entered an overheated-bull phase and traders maintained high unrealized profit margins.
After this, selling among BTC traders commenced, capitalizing on these elevated profit margins. This scale of selling hadn’t been observed since May 2019.
Additionally, significant Bitcoin holders intensified their selling activities, while miners also began offloading their holdings amid the soaring prices.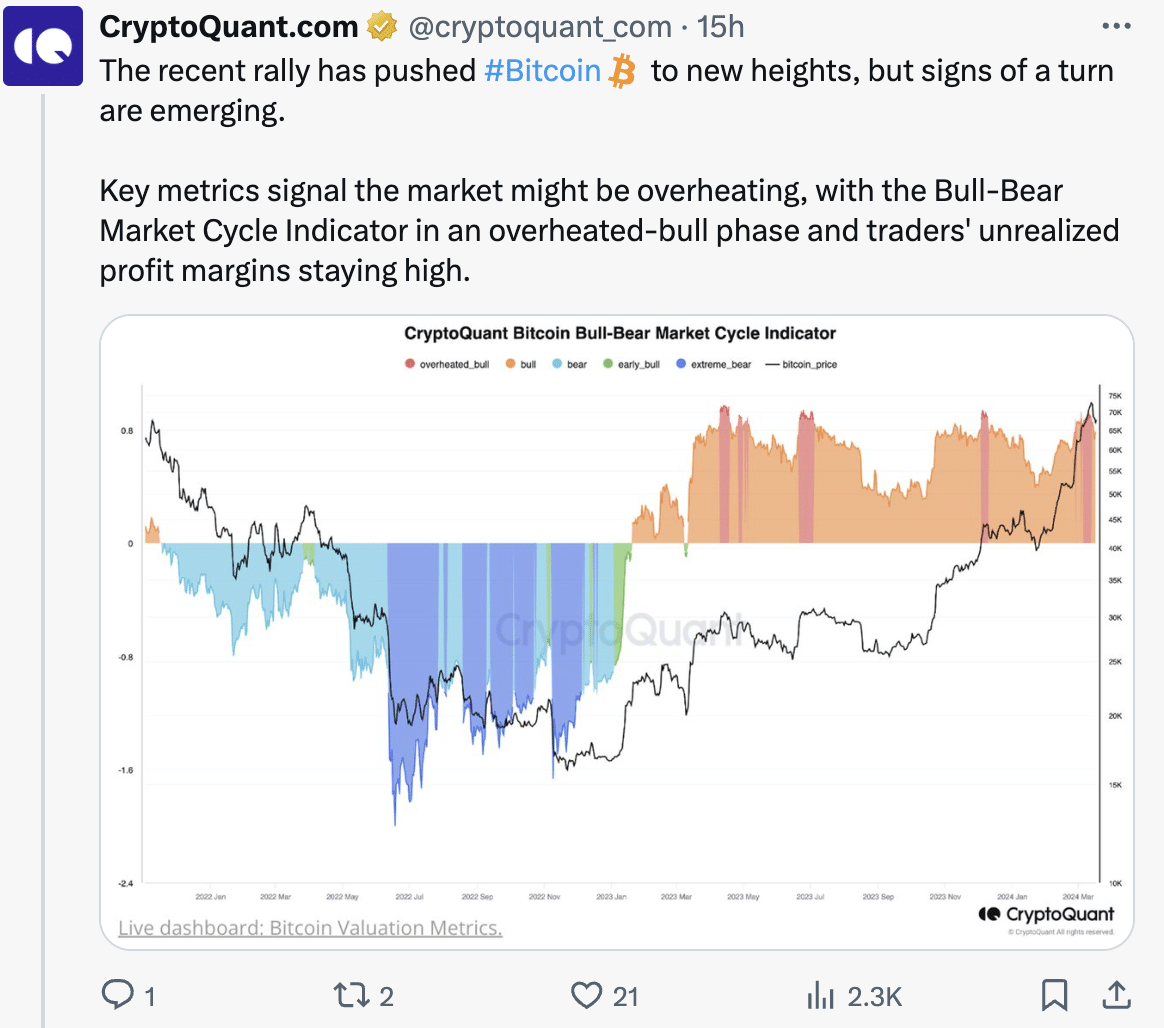 Source: X
These factors could impact BTC’s journey past the $70,000 mark negatively. At press time, BTC was trading at $$64,749.87 and its price had declined by 3.44% in the last 24 hours.
Realistic or not, here’s BTC’s market cap in ETH terms
Interestingly, the MVRV ratio had remained low, signifying that many holders were still not profitable. The low MVRV ratio suggested that the current uptick in price may have been caused by new entrants who still haven’t seen profits yet.
This makes it much more likely for BTC to reach $70,000 as profit won’t be possible at current levels. However, sentiment might shift as prices grow past $70,000 and the likelihood of correction would also grow.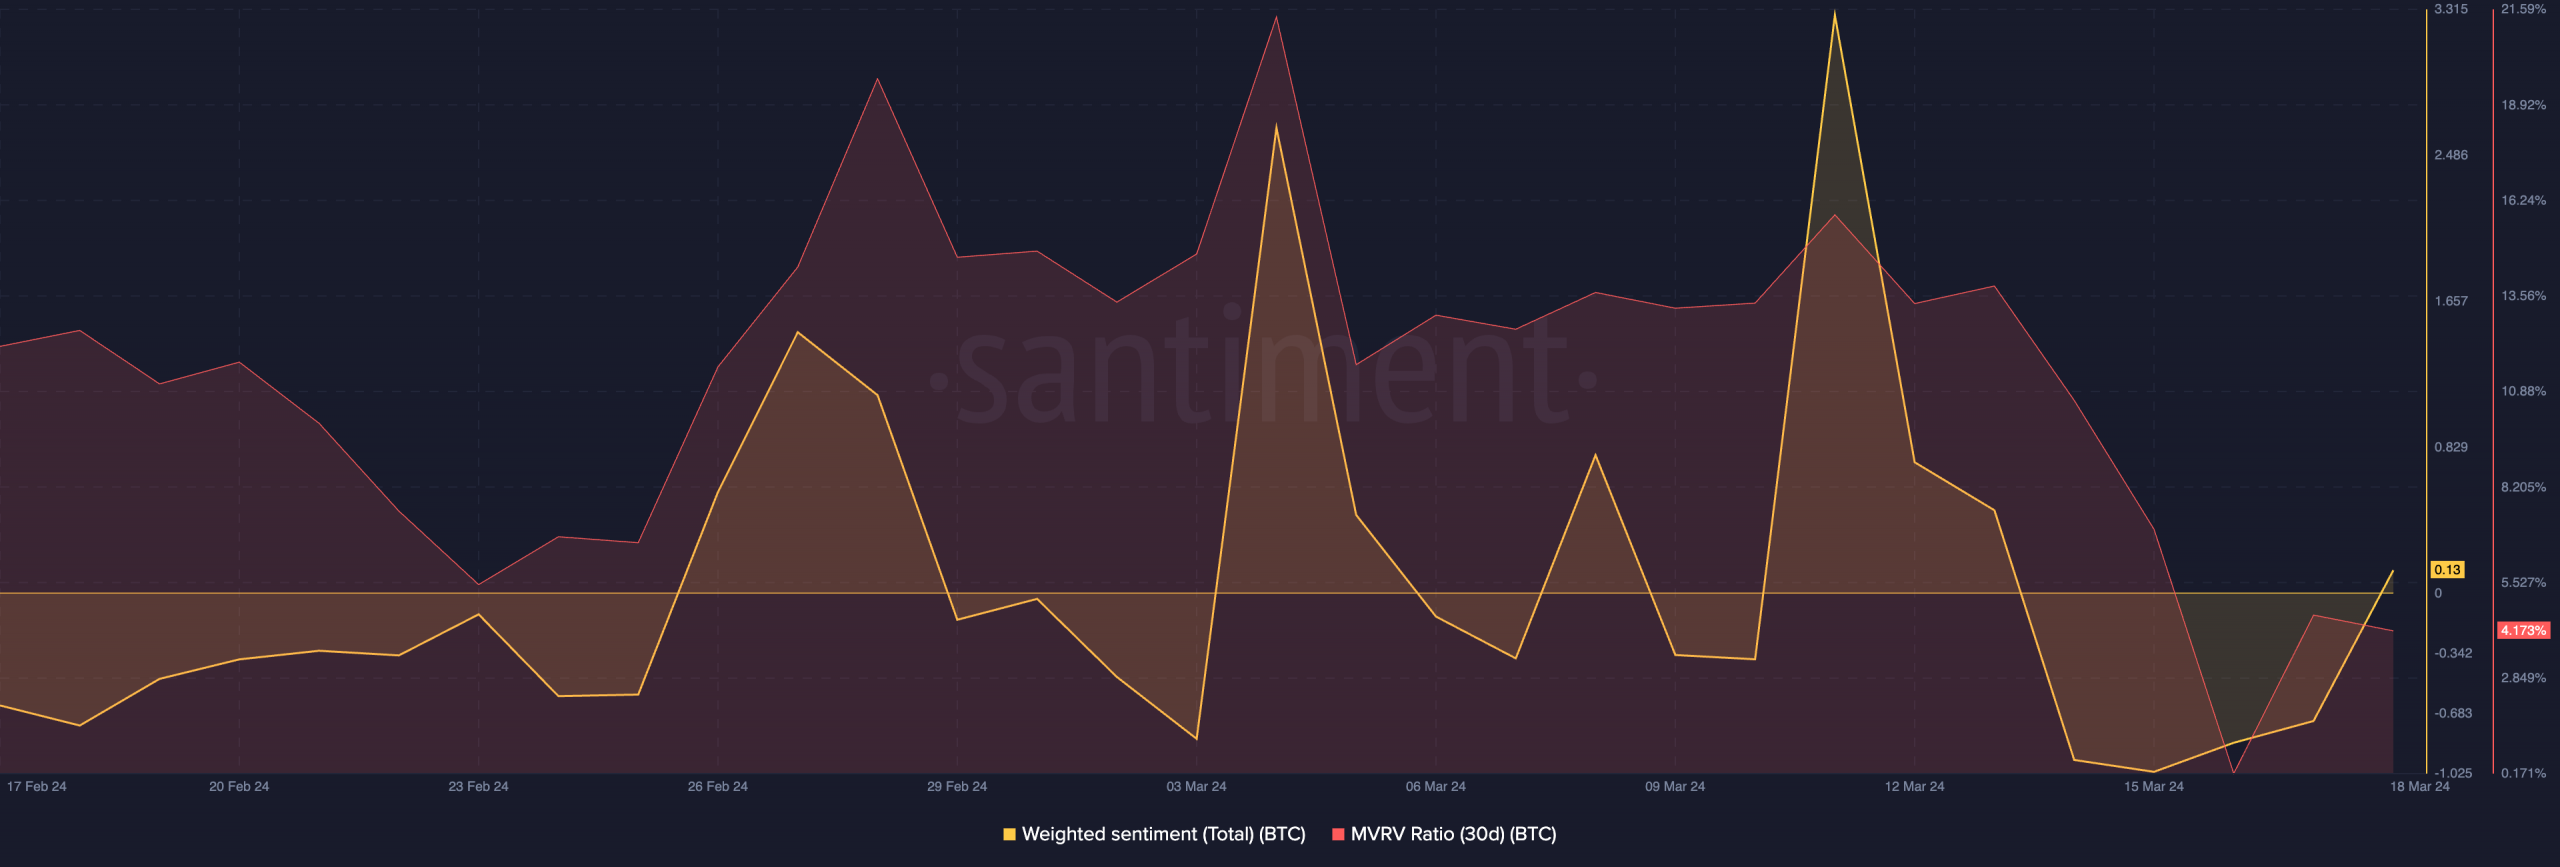 Source: Santiment
Previous: WIF’s 18% drop: Identifying if the price bubble is popping now
Next: FLOKI’s price crashes 9% in 24 hours: Should you cut your losses or hold?
Bitcoin: Small holders are hoarding; BTC to $70K again?
2min Read
As prices soared, smaller Bitcoin addresses initiated the accumulation of BTC.
- Relatively smaller Bitcoin addresses begin to accumulate BTC as prices surge.
- Profitability remained low, reducing the chances of sell-offs anytime soon.
Ever since Bitcoin[BTC] has passed the $70,000 mark and then witnessed a correction, speculation around what will happen next to the coin has flooded the crypto sphere.
Crabs and Fishes take the pie
The price of Bitcoin may rally due to the behavior of two distinct groups of holders known as “crabs” and “fishes.” These terms refer to holders with Bitcoin holdings ranging from 1 to 10 BTC for crabs and 10 to 100 BTC for fishes.
Recent observations suggest a potential regime change among these holders, transitioning from a phase of distribution to accumulation.
Both crabs and fishes have experienced the highest level of accumulation since November 2023. Moreover, there are indications that even smaller holders, with holdings of 0 to 1 BTC, are joining this accumulation trend, as evidenced by recent data.
While this accumulation broadens the investor base, it also concentrates holdings among these mid-tier investors, which could lead to more centralized control over the market compared to a scenario with a wider distribution of smaller holdings controlled primarily by whales.Source: X
Some challenges ahead
However, key metrics indicated that the market had potentially overheated, as evidenced by the Bull-Bear Market Cycle Indicator. It entered an overheated-bull phase and traders maintained high unrealized profit margins.
After this, selling among BTC traders commenced, capitalizing on these elevated profit margins. This scale of selling hadn’t been observed since May 2019.
Additionally, significant Bitcoin holders intensified their selling activities, while miners also began offloading their holdings amid the soaring prices.Source: X
These factors could impact BTC’s journey past the $70,000 mark negatively. At press time, BTC was trading at $$64,749.87 and its price had declined by 3.44% in the last 24 hours.
Realistic or not, here’s BTC’s market cap in ETH terms
Interestingly, the MVRV ratio had remained low, signifying that many holders were still not profitable. The low MVRV ratio suggested that the current uptick in price may have been caused by new entrants who still haven’t seen profits yet.
This makes it much more likely for BTC to reach $70,000 as profit won’t be possible at current levels. However, sentiment might shift as prices grow past $70,000 and the likelihood of correction would also grow.Source: Santiment
Previous: WIF’s 18% drop: Identifying if the price bubble is popping now
Next: FLOKI’s price crashes 9% in 24 hours: Should you cut your losses or hold?