Mastering the Double Top Pattern in Technical Analysis

In the dynamic world of financial markets, traders and investors rely on various technical analysis tools to identify potential trends and reversals. Among these tools, the double top pattern stands out as a reliable indicator of a potential trend reversal. In this article, we'll delve into the intricacies of the double top pattern, exploring its characteristics, formation, and how traders can use it to make informed decisions.
Understanding the Double Top Pattern:
The double top pattern is a bearish reversal pattern that occurs after an uptrend. It signifies a potential shift in market sentiment from bullish to bearish, providing traders with valuable insights into when to consider exiting a long position or even entering a short position.
- Formation:
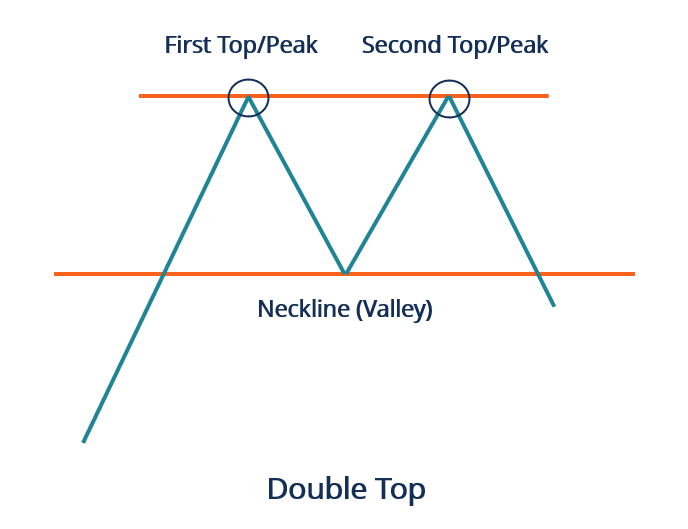
- The pattern is characterized by two peaks that reach approximately the same price level, separated by a temporary trough or a pullback.
- The first peak represents the end of the initial upward trend, followed by a retracement or pullback as traders take profits.
- The second peak is formed when prices rally again but fail to surpass the level of the first peak, creating a distinct resistance level.
- Volume Analysis:
- Volume analysis plays a crucial role in confirming the validity of the double top pattern. Traders look for an increase in volume during the formation of the second peak, signaling potential selling pressure.
- Neckline:
- The neckline is a horizontal line drawn across the lows between the two peaks. It serves as a crucial level that, when breached, confirms the pattern's validity.
Interpreting the Double Top Pattern:
- Confirmation:
- The confirmation of the double top pattern occurs when prices break below the neckline. This breakout should be accompanied by increased volume, further validating the bearish reversal signal.
- Price Target:
- Traders often estimate the potential price decline by measuring the distance from the neckline to the highest point of the double top and projecting it downward from the breakout point.
- False Signals:
- While the double top pattern is a reliable indicator, false signals can occur. Traders should exercise caution and use additional technical analysis tools or confirmation signals to validate the pattern.
- Timeframe Considerations:
- The double top pattern can manifest on various timeframes, from intraday charts to longer-term charts. Traders should adjust their strategies based on the timeframe they are trading.
- Retest of the Neckline:
- After the breakout, it's common for prices to retest the neckline from the underside. This retest provides an opportunity for traders to enter short positions with a tighter stop-loss.
The double top pattern is a valuable tool for traders seeking to identify potential trend reversals and capitalize on changing market dynamics. By understanding the pattern's formation, confirming signals, and using appropriate risk management strategies, traders can integrate the double top pattern into their technical analysis toolkit. However, it's essential to remember that no pattern is foolproof, and traders should use the double top in conjunction with other indicators for a well-rounded approach to decision-making in the ever-evolving financial markets.


