Bonding curves
Introduction
If you have been in DeFi a while, you probably heard of “bonding curve”. What is it? What is it used for? The article tries to answer those and other questions.
Bonding curve is a mathematical formula, nothing more. It is a type of automated market maker (AMM) that describes the relationship between the token price and its supply. The tokens of the protocols using bonding curves can be bought at the price shown at the curve.
To understand how a bonding curve works, let’s look at an example. The linear bonding curve is the simplest one.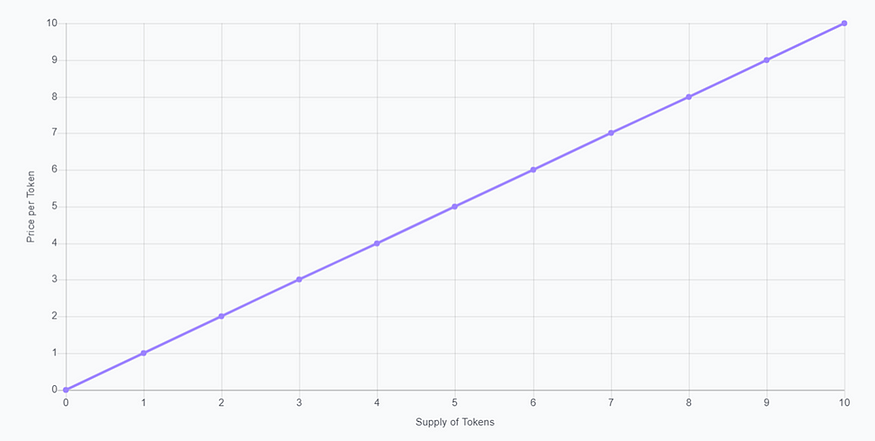 We see that the price is low when the token supply is low too. This design incentivizes early investors. The price increases as more tokens are minted (i.e., supply increases). This is called “buying up” the curve. On the contrary, when an investor sells the tokens, he “sells down” the curve. The tokens are burnt which decreases the token supply. As a result, the price will fall as well.
Let’s say, Alice is the first investor of the project, and she buys the token shown on the chart above. She buys 4 tokens for $10. How do we get $10? Well, for the first token she will pay $1, the price corresponding to the 1 token on the chart. By the same logic, she will buy the next tokens for $2, $3, and $4. So, she will buy 10 tokens for $10.
Now, if Bob wants to purchase 10 tokens, he will pay $26: $5 for the 5th token, $6 for the 6th token, $7 for the 7th token, $8 for the 8th token. Bob pays more because Alice invested first in the tokens, and by doing so she pushed the token price up.
Now what happens if Alice decides to sell her tokens? She will get $26 for the tokens for which she paid $10. This once again points to the fact that bonding curve benefits early adopters. Once Alice, our early investor, sells her tokens, they are burnt. It means that the supply decreases which drives the token value down.
Different shapes of bonding curves
Different bonding curves can be used by developers for different purposes. There are mainly four shapes of bonding curves — sigmoid, quadratic, negative exponential, linear.
Sigmoid curve can be used by the projects which believe that they will go viral. The purposing of applying a sigmoid curve here is to reward early investors. Initially, the token costs low encouraging early adopters. Once the price reaches the inflection points, it surges dramatically. After that, the token reaches a plateau settling into maturity. Investors purchasing the token after the inflection point are mainstream adopters who will be heavily charged.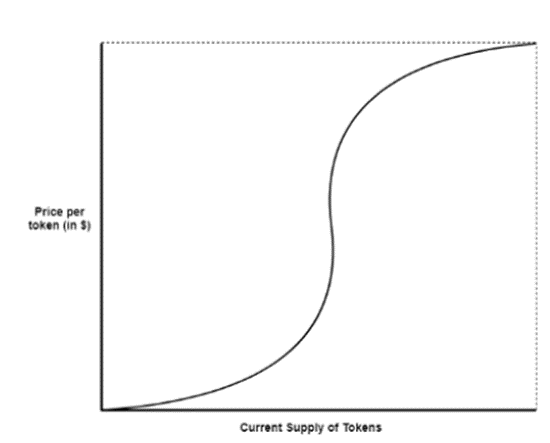 A simple sigmoid curve can be described by the formula
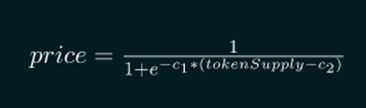 In this formula, c1 indicates how fast the token price increases in the growth phase. The inflection point of the curve depends on the second parameter, c2. This kind of the curve can also be used by projects which want to attract large investors’ funds. Since the price volatility is low during the initial phase, the slippage is low too which means that investors can commit capital to yield farming or staking.
Quadratic curve
Quadratic curve also serves the purpose of rewarding first investors. Once the token is getting adoption, the token price increases drastically. Not only is the token price low initially but also it accelerates more with the increasing supply. Quadratic curve was implemented by the Bancor protocol among others.
The quadratic curve is the special case of polynomial curves which can be described by the formula
y = a * x^n
where y is the token price; x indicates token supply and n is the number greater than 1. The larger variables a and especially n are, the more rapidly the price will increase.
The problem with the polynomial curve is that it grows fast resulting in an unstable ecosystem. We would want the token price to grow organically fast in the beginning, and to settle into more stable maturity once it gets enough adoption. Growing into unsustainable levels may discourage investors to adopt the token.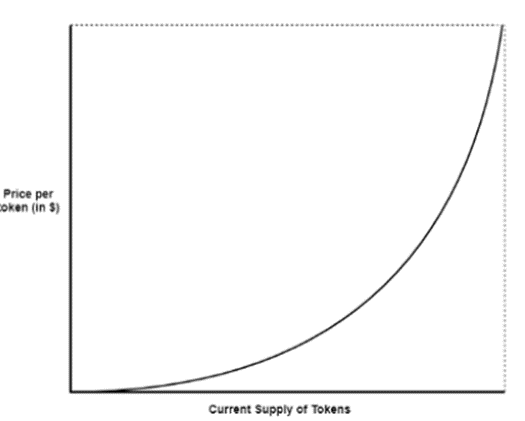 Negative exponential (sub-linear) curve
If you want to encourage users to adopt the token but also not to discourage mainstream adopters, you can use a negative exponential or sub-linear curve. This kind of curve accelerates fast in the beginning after which it decelerates until the point when it reaches a plateau. Its shape (slowly growing with the token supply) allows not to heavily charge late investors. Sub-linear curves can be constructed with the logarithmic or root based formulas, such as
y = log (tokenSupply)
or
y = tokenSupply^n
where n < 1.