Transform a Python script into an interactive, web app, and make it performant

A guide on how to turn a script, that outputs an image of a hurricane track, into a shareable app using Panel, and the best practices to improve the UX. Try the app here: https://huggingface.co/spaces/ahuang11/hurdat_tracks_viewer
Try the app here: https://huggingface.co/spaces/ahuang11/hurdat_tracks_viewer
Intro to the static script
import tropycal.tracks as tracks

track_dataset = tracks.TrackDataset(basin="both", source="hurdat")
track_dataset.plot_storm(("Andrew", 1992))
When this script is run in a Jupyter notebook cell, it outputs an image of Hurricane Andrew’s devastating track with its associated intensity.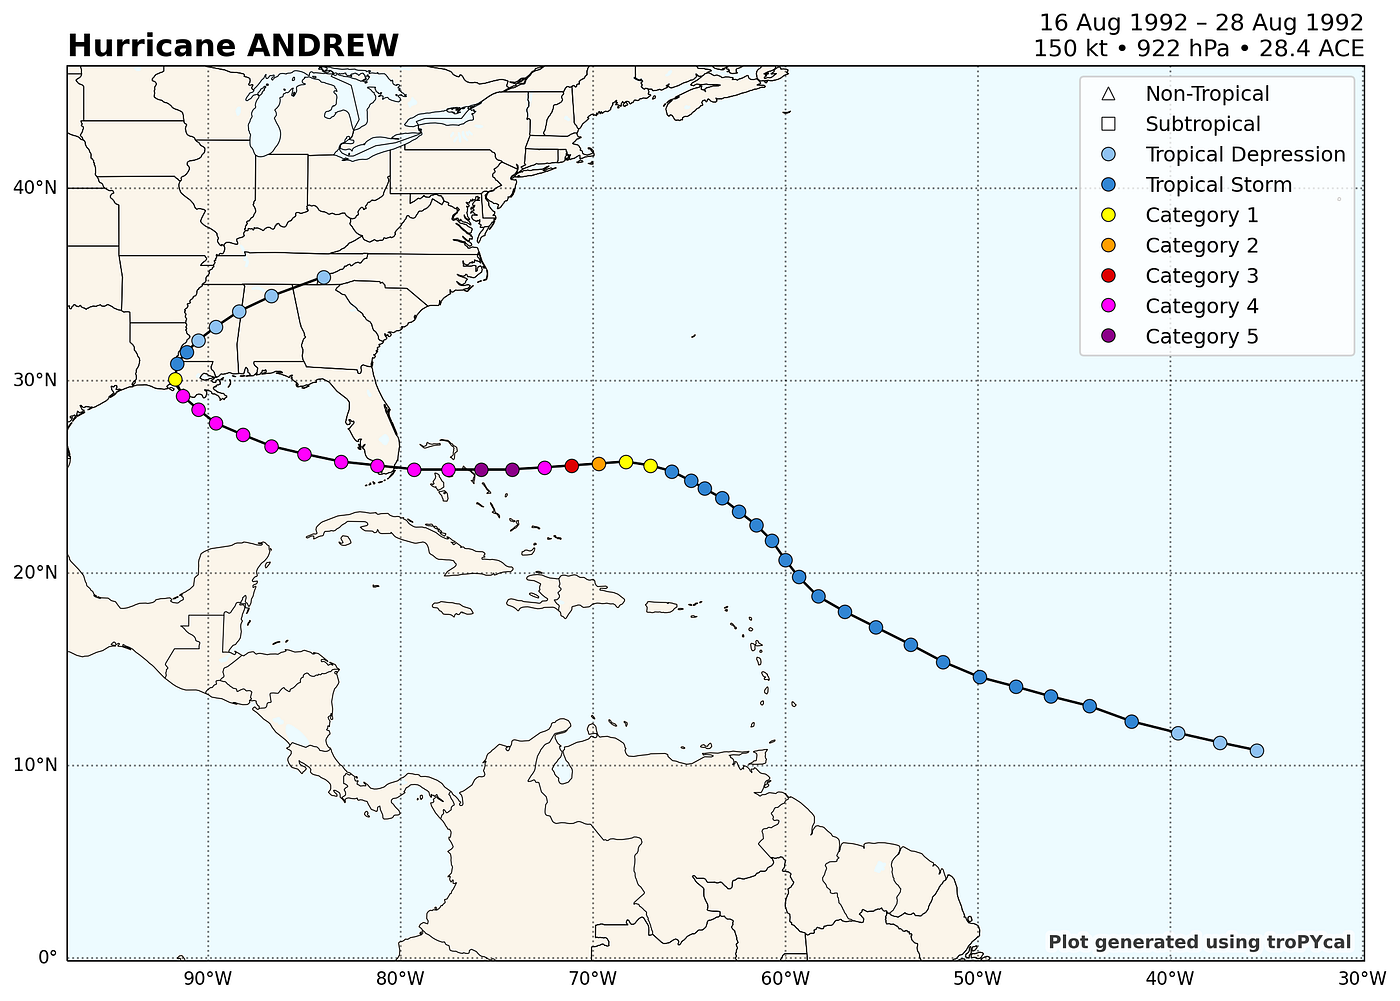 It’s informative and beautiful, but what if the user wants to see other hurricane tracks too?
Why web app?
By converting it to a web app, you can make it more accessible and interactive!
- Accessible: Web apps are accessible through any web browser and users do not have to set up a Python environment or install dependencies.
- Interactive: With an interactive web app, instead of manually typing values, users can control widgets to do so!
TLDR
Here’s the final, optimized code since it could be self-explanatory if you don’t want to read the entire guide:
import matplotlib.pyplot as plt
import pandas as pd
import panel as pn
import tropycal.tracks as tracks

pn.extension("perspective")

@pn.cache
def initialize_data():
    track_dataset = tracks.TrackDataset(basin="both", source="hurdat")
    basin_df = pd.DataFrame.from_dict(track_dataset.data, orient="index")
    return track_dataset, basin_df

def update_name_options(year):
    names = sorted(basin_df.query(f"year == {year}")["name"].unique())
    name_select.options = names
    if not name_select.value or name_select.value not in names:
        name_select.value = names[0] if names else None

def update_storm_preview(name, year):
    try:
        storm_preview.loading = True
        storm_id = track_dataset.get_storm_id((name, year))
        axes = track_dataset.plot_storm(storm_id)
        plt.close(axes.figure)
        storm_preview.object = axes.figure
        storm_table.object = track_dataset.get_storm(storm_id).to_dataframe()
    finally:
        storm_preview.loading = False

# Instantiate Widgets & Pane
year_slider = pn.widgets.IntSlider(
    name="Year", value=1950, start=1950, end=2022, step=1
)
name_select = pn.widgets.Select(name="Name")
storm_preview = pn.pane.Matplotlib(plt.figure(), sizing_mode="stretch_both")
storm_table = pn.pane.Perspective(editable=False, sizing_mode="stretch_both")

# Layout the app
sidebar = pn.Column(year_slider, name_select)
main = pn.Tabs(("Preview", storm_preview), ("Table", storm_table))

template = pn.template.FastListTemplate(
    sidebar=sidebar,
    main=main,
)

# Initialize data
track_dataset, basin_df = initialize_data()

# Define Callbacks
pn.bind(update_name_options, year=year_slider.param.value_throttled, watch=True)
pn.bind(update_storm_preview, name=name_select, year=year_slider.param.value_throttled, watch=True)

# Pre-populate values
year_slider.param.trigger("value_throttled")

# Serve the app
template.show()
Or, if you just want to skip the basics of building a Panel app and simply want to learn how to optimize the UX, scroll down to the “Improving the UX” section!
Laying out the dashboard
Interested? Let’s get started; here’s how I envision the web app to look: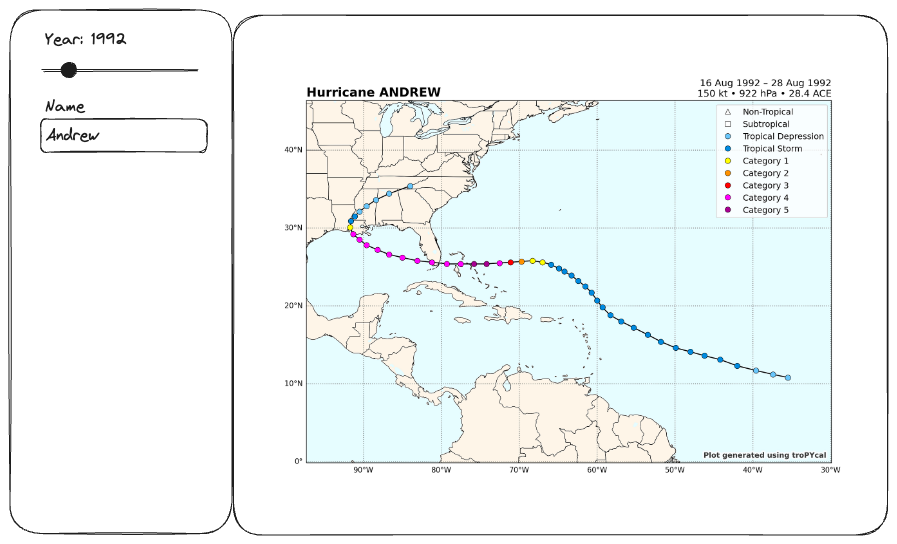 On the sidebar, we have two widgets, a slider to pick the year and a text input to enter the name. On the right, we have the output image pane.
Since hurricane names are NOT unique and gets recycled across the years (unless it’s a significant hurricane, then the name gets retired), we need the name input’s allowable options to correspond to the year slider’s value.
Based on this idea in mind, we can start building the web app! Let’s first start with the imports:
import matplotlib.pyplot as plt  # for a `fig` placeholder
import pandas as pd  # to organize all the available data
import panel as pn  # for building the web app!
import tropycal.tracks as tracks  # for generating the tracks' images
The next step is instantiating the widgets and pane, which is super easy with Panel:
year_slider = pn.widgets.IntSlider(
    name="Year", value=1950, start=1950, end=2022, step=1
)
name_select = pn.widgets.Select(name="Name")
storm_preview = pn.pane.Matplotlib(plt.figure(), sizing_mode="scale_both")
Now, we assemble the widgets and pane into a layout — again super easy:
sidebar = pn.Column(year_slider, name_select)
main = pn.Row(storm_preview)

template = pn.template.FastListTemplate(
    sidebar=sidebar,
    main=main,
)
Add one more line so that the web app can be displayed:
template.show()
In a notebook, you can simply run all the code, or if it’s saved as a script named app.py you can execute python app.py. This will open a new browser tab displaying something similar to the following: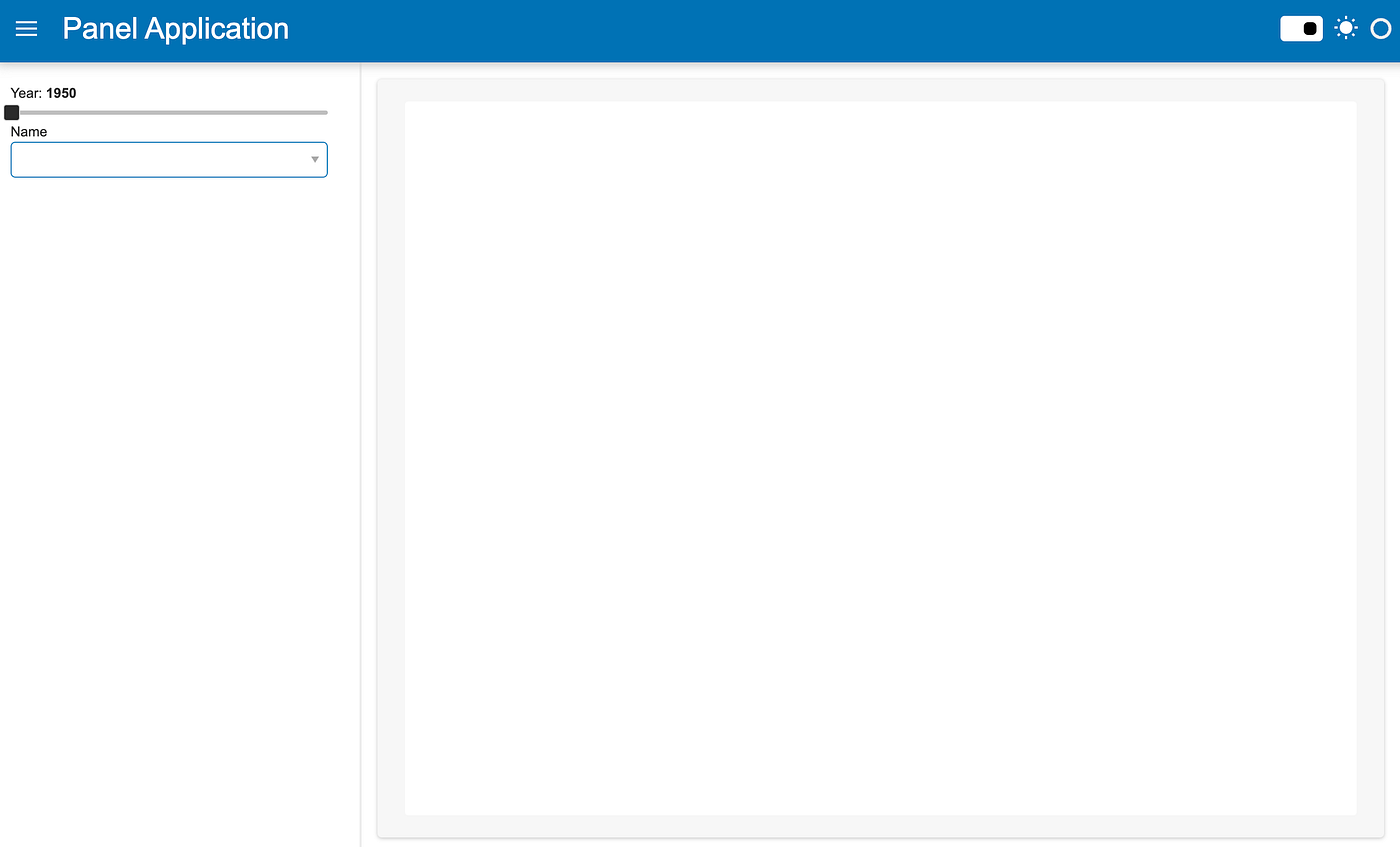 If you modify the slider, nothing happens since we haven’t added callbacks. If you try to click on the name select, nothing pops up, because we haven’t populated it with any options.
Adding interactivity
Let’s make it more interesting! To do so, let’s initialize the tracks dataset and pass its data to pandas.
track_dataset = tracks.TrackDataset(basin="both", source="hurdat")
basin_df = pd.DataFrame.from_dict(track_dataset.data, orient="index")
Here, we organize all the documented HURDAT hurricanes in both US basins, East Pacific and West Atlantic, into a pandas dataframe.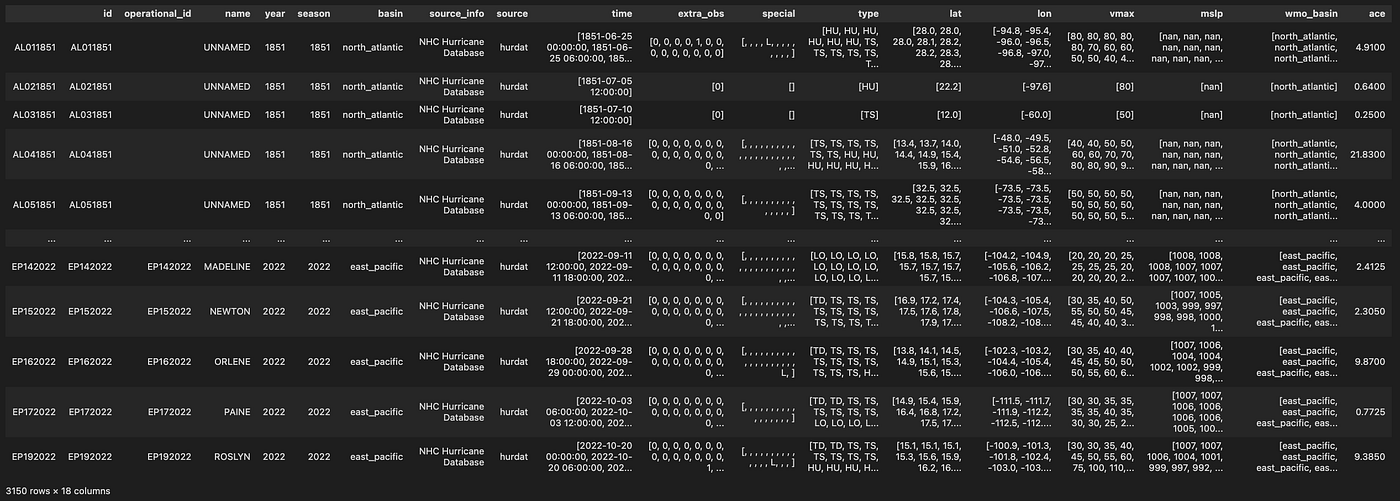 This will be useful for finding all the hurricane names corresponding to the chosen year and populate name select’s options. To do so, we define a function that accepts one input,
 year:
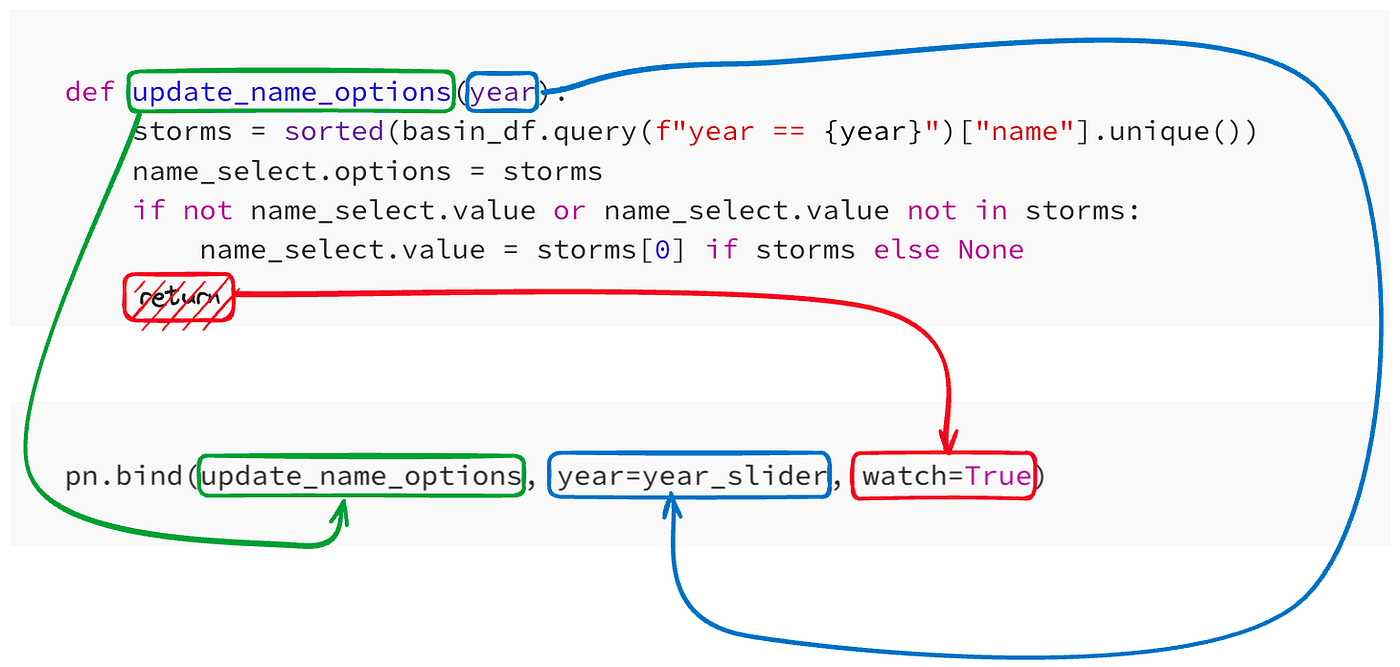
def update_name_options(year):
    storms = sorted(basin_df.query(f"year == {year}")["name"].unique())
    name_select.options = storms
    if not name_select.value or name_select.value not in storms:
        name_select.value = storms[0] if storms else None
Then, to make the year slider update the allowable options for the name select upon change, we pn.bind the function, mapping the input year with the year_slider. We also set watch=True because the function does NOT have a return statement:
pn.bind(update_name_options, year=year_slider, watch=True)
 Your script should now look like the following:
import matplotlib.pyplot as plt
import pandas as pd
import panel as pn
import tropycal.tracks as tracks

def update_name_options(year):
    names = sorted(basin_df.query(f"year == {year}")["name"].unique())
    name_select.options = names
    if not name_select.value or name_select.value not in names:
        name_select.value = names[0] if names else None

# Instantiate Widgets & Pane
year_slider = pn.widgets.IntSlider(
    name="Year", value=1950, start=1950, end=2022, step=1
)
name_select = pn.widgets.Select(name="Name")
storm_preview = pn.pane.Matplotlib(plt.figure(), sizing_mode="scale_both")

# Layout the app
sidebar = pn.Column(year_slider, name_select)
main = pn.Row(storm_preview)

template = pn.template.FastListTemplate(
    sidebar=sidebar,
    main=main,
)

# Initialize Data
track_dataset = tracks.TrackDataset(basin="both", source="hurdat")
basin_df = pd.DataFrame.from_dict(track_dataset.data, orient="index")

# Define Callbacks
pn.bind(update_name_options, year=year_slider, watch=True)

# Serve the app
template.show()
And if you run it and change the year with the slider, you should see the name select being populated!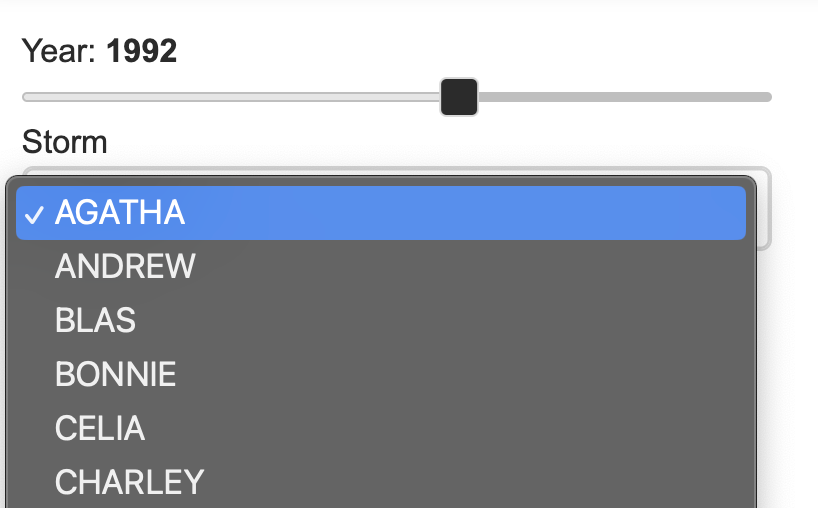 Now with those concepts in mind, we again define a function to plot the hurricane’s tracks — this time with two inputs, name and year.
We get the official, unique ID of the hurricane (e.g. AL011851) and pass it to the plot_storm method, which plots the storm tracks. To preview the storm tracks on the app, we set storm_preview.object, our previously defined Matplotlib pane, to axes.figure. We then close the figure since the pane internally embeds the figure data.
def update_storm_preview(name, year):
    storm_id = track_dataset.get_storm_id((name, year))
    axes = track_dataset.plot_storm(storm_id)
    storm_preview.object = axes.figure
    plt.close(axes.figure)
Finally, we bind this function to the widgets, so that when the user changes the value of either widgets, update_storm_preview gets triggered, which results in the tracks preview being updated!
pn.bind(update_storm_track, name=name_select, year=year_slider, watch=True)
With all that done, you should have something like this:
import matplotlib.pyplot as plt
import pandas as pd
import panel as pn
import tropycal.tracks as tracks

def update_name_options(year):
    names = sorted(basin_df.query(f"year == {year}")["name"].unique())
    name_select.options = names
    if not name_select.value or name_select.value not in names:
        name_select.value = names[0] if names else None

def update_storm_preview(name, year):
    storm_id = track_dataset.get_storm_id((name, year))
    axes = track_dataset.plot_storm(storm_id)
    plt.close(axes.figure)
    storm_preview.object = axes.figure

# Instantiate Widgets & Pane
year_slider = pn.widgets.IntSlider(
    name="Year", value=1950, start=1950, end=2022, step=1
)
name_select = pn.widgets.Select(name="Name")
storm_preview = pn.pane.Matplotlib(plt.figure(), sizing_mode="scale_both")

# Layout the app
sidebar = pn.Column(year_slider, name_select)
main = pn.Row(storm_preview)

template = pn.template.FastListTemplate(
    sidebar=sidebar,
    main=main,
)

# Initialize Data
track_dataset = tracks.TrackDataset(basin="both", source="hurdat")
basin_df = pd.DataFrame.from_dict(track_dataset.data, orient="index")

# Define Callbacks
pn.bind(update_name_options, year=year_slider, watch=True)
pn.bind(update_storm_preview, name=name_select, year=year_slider, watch=True)

# Serve the app
template.show()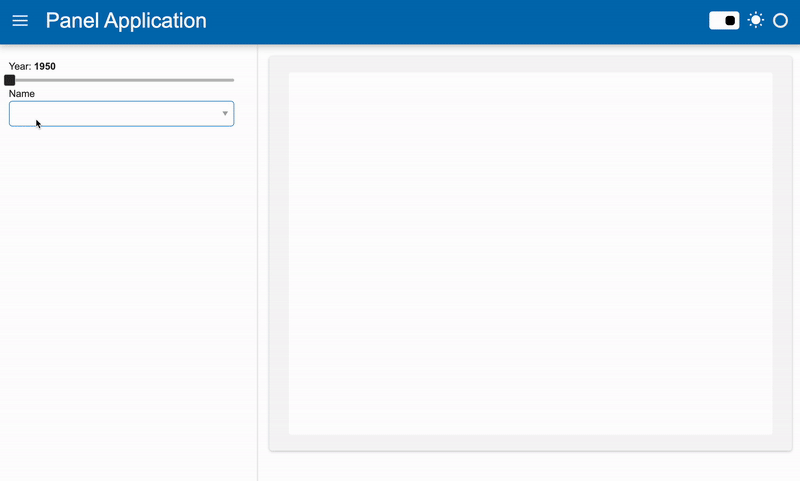
Improving the UX
When running the app, I noticed:
- It takes a while to initialize the data, thus the app doesn’t launch until 5 seconds later (using my local machine and internet speed).
- The storm tracks preview takes a second or two to buffer, but there’s barely any indication that it’s buffering besides the small indicator at the top right.
- Adjusting the year slider to get to the desired year (i.e. from 1950, to 2000) triggers way too many undesired updates.
- The title is not reflective of what the app does.
- The name select doesn’t populate until the year slider is modified; ideally the names for the default year, 1950, should be populated prior to user interaction.
Here’s an overview on how to address these issues:
pn.cacheso it reuses the loaded data on second time.storm_preview.loading = True/Falseintry/finallyso it displays a giant loading symbol while it buffers.year_slider.param.value_throttledso it only triggers events on mouse-up.title="HURDAT Tracks Viewer"so the app has an appropriate titleyear_slider.param.trigger("value_throttled")so it pre-populates the names.
I implemented the fixes below, with comments labeling where (e.g. # 1.).
import matplotlib.pyplot as plt
import pandas as pd
import panel as pn
import tropycal.tracks as tracks

@pn.cache  # 1.
def initialize_data():
    track_dataset = tracks.TrackDataset(basin="both", source="hurdat")
    basin_df = pd.DataFrame.from_dict(track_dataset.data, orient="index")
    return track_dataset, basin_df

def update_name_options(year):
    names = sorted(basin_df.query(f"year == {year}")["name"].unique())
    name_select.options = names
    if not name_select.value or name_select.value not in names:
        name_select.value = names[0] if names else None

def update_storm_preview(name, year):
    try:  # 2.
        storm_preview.loading = True
        storm_id = track_dataset.get_storm_id((name, year))
        axes = track_dataset.plot_storm(storm_id)
        plt.close(axes.figure)
        storm_preview.object = axes.figure
    finally:
        storm_preview.loading = False

# Instantiate Widgets & Pane
year_slider = pn.widgets.IntSlider(
    name="Year", value=1950, start=1950, end=2022, step=1
)
name_select = pn.widgets.Select(name="Name")
storm_preview = pn.pane.Matplotlib(plt.figure(), sizing_mode="scale_both")

# Layout the app
sidebar = pn.Column(year_slider, name_select)
main = pn.Row(storm_preview)

template = pn.template.FastListTemplate(
    sidebar=sidebar,
    main=main,
    title="HURDAT Tracks Viewer"  # 4.
)

# Initialize data
track_dataset, basin_df = initialize_data()

# Define Callbacks
pn.bind(update_name_options, year=year_slider.param.value_throttled, watch=True)  # 3.
pn.bind(update_storm_preview, name=name_select, year=year_slider.param.value_throttled, watch=True)  #  3.

# Pre-populate values
year_slider.param.trigger("value_throttled")  # 5.

# Serve the app
template.show()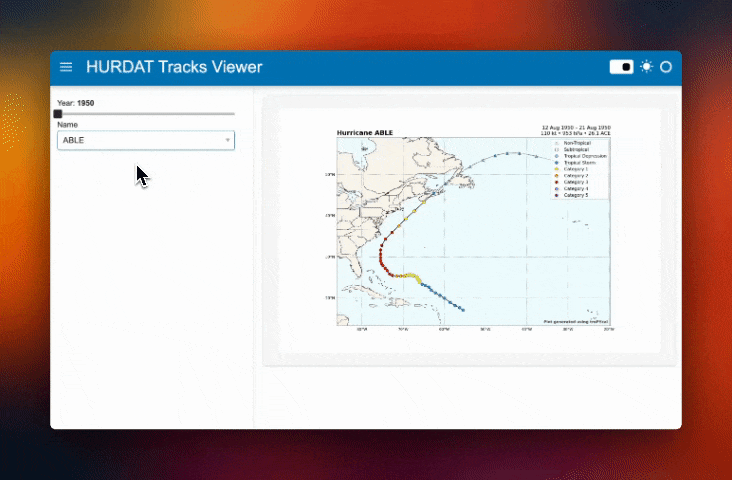
Bonus: Adding a Perspective viewer
As a bonus, we can also view/download the raw data and a few custom charts using Perspective by:
- Calling
pn.extension("perspective") - Instantiating the Perspective pane
- Wrapping the Perspective pane to a Tabs layout, replacing the previous Row.
- Getting the dataframe specific to the storm.
import matplotlib.pyplot as plt
import pandas as pd
import panel as pn
import tropycal.tracks as tracks

pn.extension("perspective")  # 1.

@pn.cache
def initialize_data():
    track_dataset = tracks.TrackDataset(basin="both", source="hurdat")
    basin_df = pd.DataFrame.from_dict(track_dataset.data, orient="index")
    return track_dataset, basin_df

def update_name_options(year):
    names = sorted(basin_df.query(f"year == {year}")["name"].unique())
    name_select.options = names
    if not name_select.value or name_select.value not in names:
        name_select.value = names[0] if names else None

def update_storm_preview(name, year):
    try:
        storm_preview.loading = True
        storm_id = track_dataset.get_storm_id((name, year))
        axes = track_dataset.plot_storm(storm_id)
        plt.close(axes.figure)
        storm_preview.object = axes.figure
        storm_table.object = track_dataset.get_storm(storm_id).to_dataframe() # 4.
    finally:
        storm_preview.loading = False

# Instantiate Widgets & Pane
year_slider = pn.widgets.IntSlider(
    name="Year", value=1950, start=1950, end=2022, step=1
)
name_select = pn.widgets.Select(name="Name")
storm_preview = pn.pane.Matplotlib(plt.figure(), sizing_mode="stretch_both")
storm_table = pn.pane.Perspective(editable=False, sizing_mode="stretch_both") # 2.

# Layout the app
sidebar = pn.Column(year_slider, name_select)
main = pn.Tabs(("Preview", storm_preview), ("Table", storm_table))  # 3.

template = pn.template.FastListTemplate(
    sidebar=sidebar,
    main=main,
)

# Initialize data
track_dataset, basin_df = initialize_data()

# Define Callbacks
pn.bind(update_name_options, year=year_slider.param.value_throttled, watch=True)
pn.bind(update_storm_preview, name=name_select, year=year_slider.param.value_throttled, watch=True)

# Pre-populate values
year_slider.param.trigger("value_throttled")

# Serve the app
template.show()
And that’s it for this guide! Stay tuned for the next guide, which involves more advanced techniques, including wrapping this into a param.Parameterized class, usage of hv.DynamicMap, linking widgets to panes, and addition of satellite imagery associated with the hurricane!