What is crypto fundamental analysis? And What does 2024 hold for the crypto world?


What is crypto fundamental analysis?
Crypto fundamental analysis is a way of assessing the quality and potential of a cryptocurrency by looking at its underlying factors and characteristics. The main goal of crypto fundamental analysis is to determine whether a cryptocurrency is overvalued or undervalued, and to identify the best opportunities for long-term investment or short-term trading.
Crypto fundamental analysis can be divided into three main categories: project metrics, financial metrics, and on-chain metrics. Each category provides a different perspective and insight into the performance and value of a cryptocurrency.

Project metrics
Project metrics are the qualitative and quantitative aspects of a cryptocurrency project, such as its vision, mission, team, roadmap, community, partnerships, and innovation. Project metrics can help investors and traders to evaluate the credibility, legitimacy, and competitiveness of a cryptocurrency project, and to gauge its growth potential and market fit.
Some of the project metrics that are commonly used in crypto fundamental analysis are:
- Whitepaper: The whitepaper is the official document that describes the purpose, design, and features of a cryptocurrency project. It usually contains the technical specifications, the problem statement, the solution proposal, the token economics, the roadmap, and the team behind the project. The whitepaper can help investors and traders to understand the vision and goals of a cryptocurrency project, and to assess its feasibility and innovation.
- Team: The team is the group of people who are responsible for developing, maintaining, and promoting a cryptocurrency project. It usually consists of developers, researchers, marketers, advisors, and other experts in the field. The team can help investors and traders to evaluate the skills, experience, and reputation of the people behind a cryptocurrency project, and to measure their commitment and involvement.
- Roadmap: The roadmap is the plan that outlines the milestones, objectives, and deliverables of a cryptocurrency project. It usually shows the past, present, and future development stages, the expected release dates, and the progress updates. The roadmap can help investors and traders to track the achievements and challenges of a cryptocurrency project, and to anticipate its future direction and potential.
- Community: The community is the network of supporters, users, and enthusiasts of a cryptocurrency project. It usually consists of social media followers, forum members, chat group participants, and other stakeholders. The community can help investors and traders to gauge the popularity, engagement, and feedback of a cryptocurrency project, and to measure its network effect and word-of-mouth.
- Partnerships: The partnerships are the collaborations and alliances that a cryptocurrency project establishes with other entities, such as businesses, organizations, institutions, or governments. They usually aim to enhance the value proposition, the exposure, and the adoption of a cryptocurrency project. The partnerships can help investors and traders to assess the credibility, legitimacy, and competitiveness of a cryptocurrency project, and to identify its strategic advantages and opportunities.

Financial metrics
Financial metrics are the numerical and statistical indicators that reflect the financial performance and value of a cryptocurrency. They usually measure the supply, demand, and liquidity of a cryptocurrency, as well as its market share, dominance, and volatility. Financial metrics can help investors and traders to compare and contrast different cryptocurrencies, and to determine their relative strengths and weaknesses.
Some of the financial metrics that are commonly used in crypto fundamental analysis are:
- Market capitalization: The market capitalization is the total value of all the coins or tokens in circulation for a given cryptocurrency. It is calculated by multiplying the current price by the circulating supply. Market capitalization can indicate the size, popularity, and dominance of a cryptocurrency, as well as its potential for growth and appreciation.
- Trading volume: The trading volume is the amount of coins or tokens that are traded in a given period of time, usually 24 hours. It can indicate the liquidity, demand, and activity of a cryptocurrency, as well as its price movements and trends. High trading volume can signal strong interest and confidence in a cryptocurrency, while low trading volume can signal weak interest and confidence.
- Price-to-earnings (P/E) ratio: The price-to-earnings ratio is the ratio of the current price of a cryptocurrency to its annual earnings per coin or token. It can indicate the profitability, efficiency, and value of a cryptocurrency, as well as its growth potential and expectations. A low P/E ratio can signal that a cryptocurrency is undervalued and has high earnings, while a high P/E ratio can signal that a cryptocurrency is overvalued and has low earnings.
- Price-to-sales (P/S) ratio: The price-to-sales ratio is the ratio of the current price of a cryptocurrency to its annual sales per coin or token. It can indicate the revenue, utility, and value of a cryptocurrency, as well as its growth potential and expectations. A low P/S ratio can signal that a cryptocurrency is undervalued and has high sales, while a high P/S ratio can signal that a cryptocurrency is overvalued and has low sales.
- Price-to-book (P/B) ratio: The price-to-book ratio is the ratio of the current price of a cryptocurrency to its book value per coin or token. The book value is the net asset value of a cryptocurrency, calculated by subtracting its liabilities from its assets. It can indicate the equity, solvency, and value of a cryptocurrency, as well as its growth potential and expectations. A low P/B ratio can signal that a cryptocurrency is undervalued and has high assets, while a high P/B ratio can signal that a cryptocurrency is overvalued and has low assets.

On-chain metrics
On-chain metrics are the data and information that are derived from the transactions and activities that occur on the blockchain network of a cryptocurrency. They usually measure the adoption, usage, and network effect of a cryptocurrency, as well as its security, stability, and growth. On-chain metrics can help investors and traders to analyze the behavior and sentiment of the cryptocurrency market, and to identify patterns and trends.
Some of the on-chain metrics that are commonly used in crypto fundamental analysis are:
- Hash rate: The hash rate is the amount of computing power that is used to secure and validate transactions on a blockchain network. It can indicate the security, stability, and growth of a blockchain network, as well as its attractiveness and profitability for miners. A high hash rate can signal that a blockchain network is secure and popular, while a low hash rate can signal that a blockchain network is vulnerable and unpopular.
- Active addresses: The active addresses are the number of unique addresses that are involved in transactions on a blockchain network in a given period of time, usually 24 hours. They can indicate the adoption, usage, and network effect of a cryptocurrency or a blockchain network, as well as its market activity and demand. A high number of active addresses can signal that a cryptocurrency or a blockchain network is widely used and has a large user base, while a low number of active addresses can signal that a cryptocurrency or a blockchain network is rarely used and has a small user base.
- Network value to transactions (NVT) ratio: The network value to transactions ratio is the ratio of the market capitalization to the daily transaction volume of a cryptocurrency or a blockchain network. It can indicate the efficiency, utility, and value of a cryptocurrency or a blockchain network, as well as its growth potential and expectations. A low NVT ratio can signal that a cryptocurrency or a blockchain network is undervalued and has high utility, while a high NVT ratio can signal that a cryptocurrency or a blockchain network is overvalued and has low utility.
- Stock-to-flow (S2F) ratio: The stock-to-flow ratio is the ratio of the existing supply to the annual production of a cryptocurrency. It can indicate the scarcity, inflation, and value of a cryptocurrency, as well as its growth potential and expectations. A high S2F ratio can signal that a cryptocurrency is scarce and has low inflation, while a low S2F ratio can signal that a cryptocurrency is abundant and has high inflation.
- Metcalfe’s law: Metcalfe’s law is a formula that states that the value of a network is proportional to the square of the number of its users. It can indicate the network effect, adoption, and value of a cryptocurrency or a blockchain network, as well as its growth potential and expectations. A high value of Metcalfe’s law can signal that a cryptocurrency or a blockchain network has a strong network effect and a large user base, while a low value of Metcalfe’s law can signal that a cryptocurrency or a blockchain network has a weak network effect and a small user base.

How to apply crypto fundamental analysis?
Crypto fundamental analysis can be applied to any cryptocurrency or blockchain project that has a clear vision, a solid team, a working product, and a loyal community. However, some cryptocurrencies may have more or less data and information available than others, depending on their age, popularity, and transparency. Therefore, crypto fundamental analysis may require some research, estimation, and interpretation from the analyst.
To apply crypto fundamental analysis, one can follow these steps:
- Choose a cryptocurrency or a blockchain project that you are interested in or curious about.
- Gather as much data and information as possible about the project, using various sources such as whitepapers, websites, social media,
What does 2024 hold for the crypto world? Will the bull run come?
There are many factors that could influence the performance of the crypto market in 2024, but some of the most important ones are:
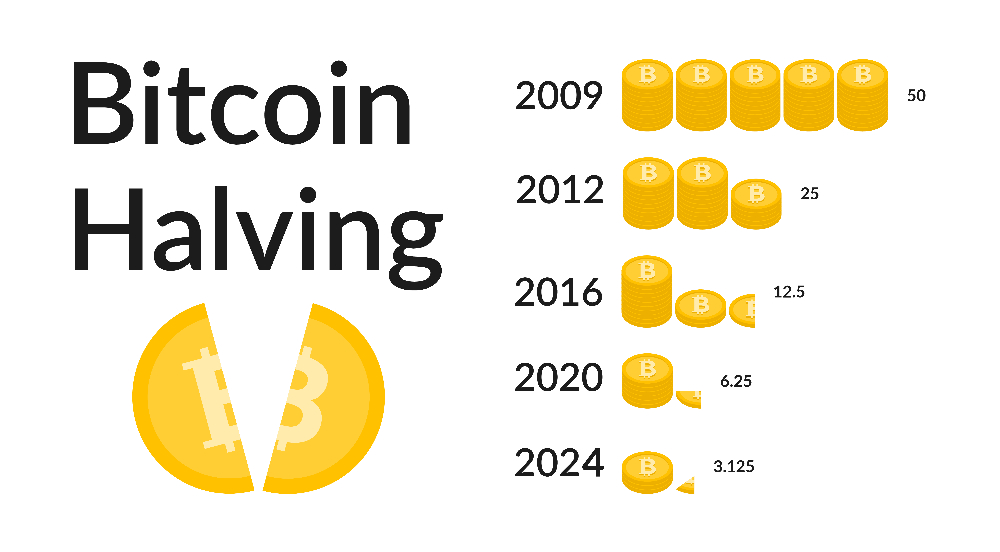
- The Bitcoin Halving Event:
- The Crypto Fundamental Indicators:

- The Regulatory Events:


