The Number of Ethereum Investors is Growing Steadily

The Number of Ethereum Investors is Growing Steadily
In the past 24 hours, Ethereum (ETH) experienced a decline of over 2%, with market indicators signaling a bearish trend. Ethereum (ETH) recently surged past the $3,600 mark as it closed the previous week. During this time, investor confidence in the leading altcoin soared as key metrics reached all-time highs. However, this confidence did little to aid ETH as its daily chart turned red.
Investors in Ethereum are on the rise. Santiment recently tweeted highlighting the fact that ETH made a significant leap over the weekend, recovering to over $3,600 after a 25% drop from March 11 to March 19.
While the price of the leading altcoin rebounded, its total number of non-zero addresses skyrocketed, surpassing 118.23K. Additionally, its mid-term MVRV ratio signaled a slight uptick.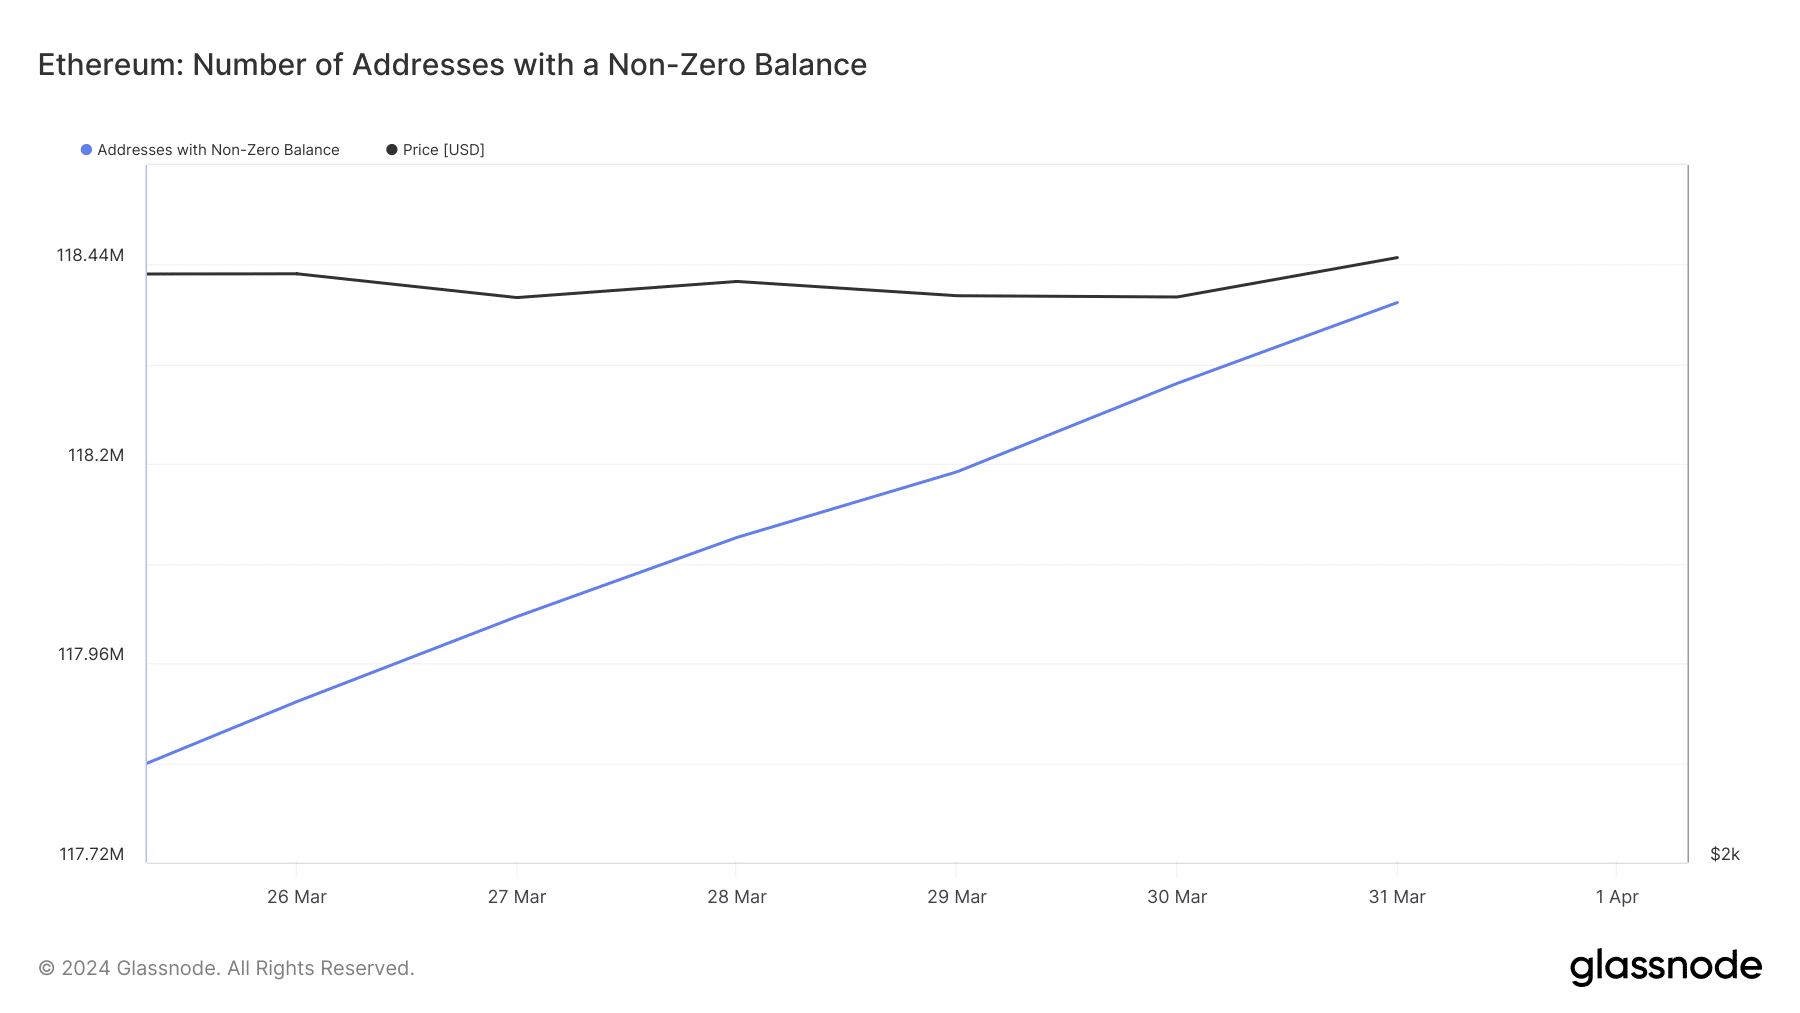
Source: Glassnode
However, the reality differs as ETH price dropped over 2.4% in the past 24 hours, plunging below $3,600 according to CoinMarketCap.
At the time of writing, Ethereum is trading at $3,547.34 with a market capitalization of over $425 billion. Despite the price drop, it’s noteworthy that the number of non-zero balance addresses for ETH continues to increase.
Expectations for Ethereum
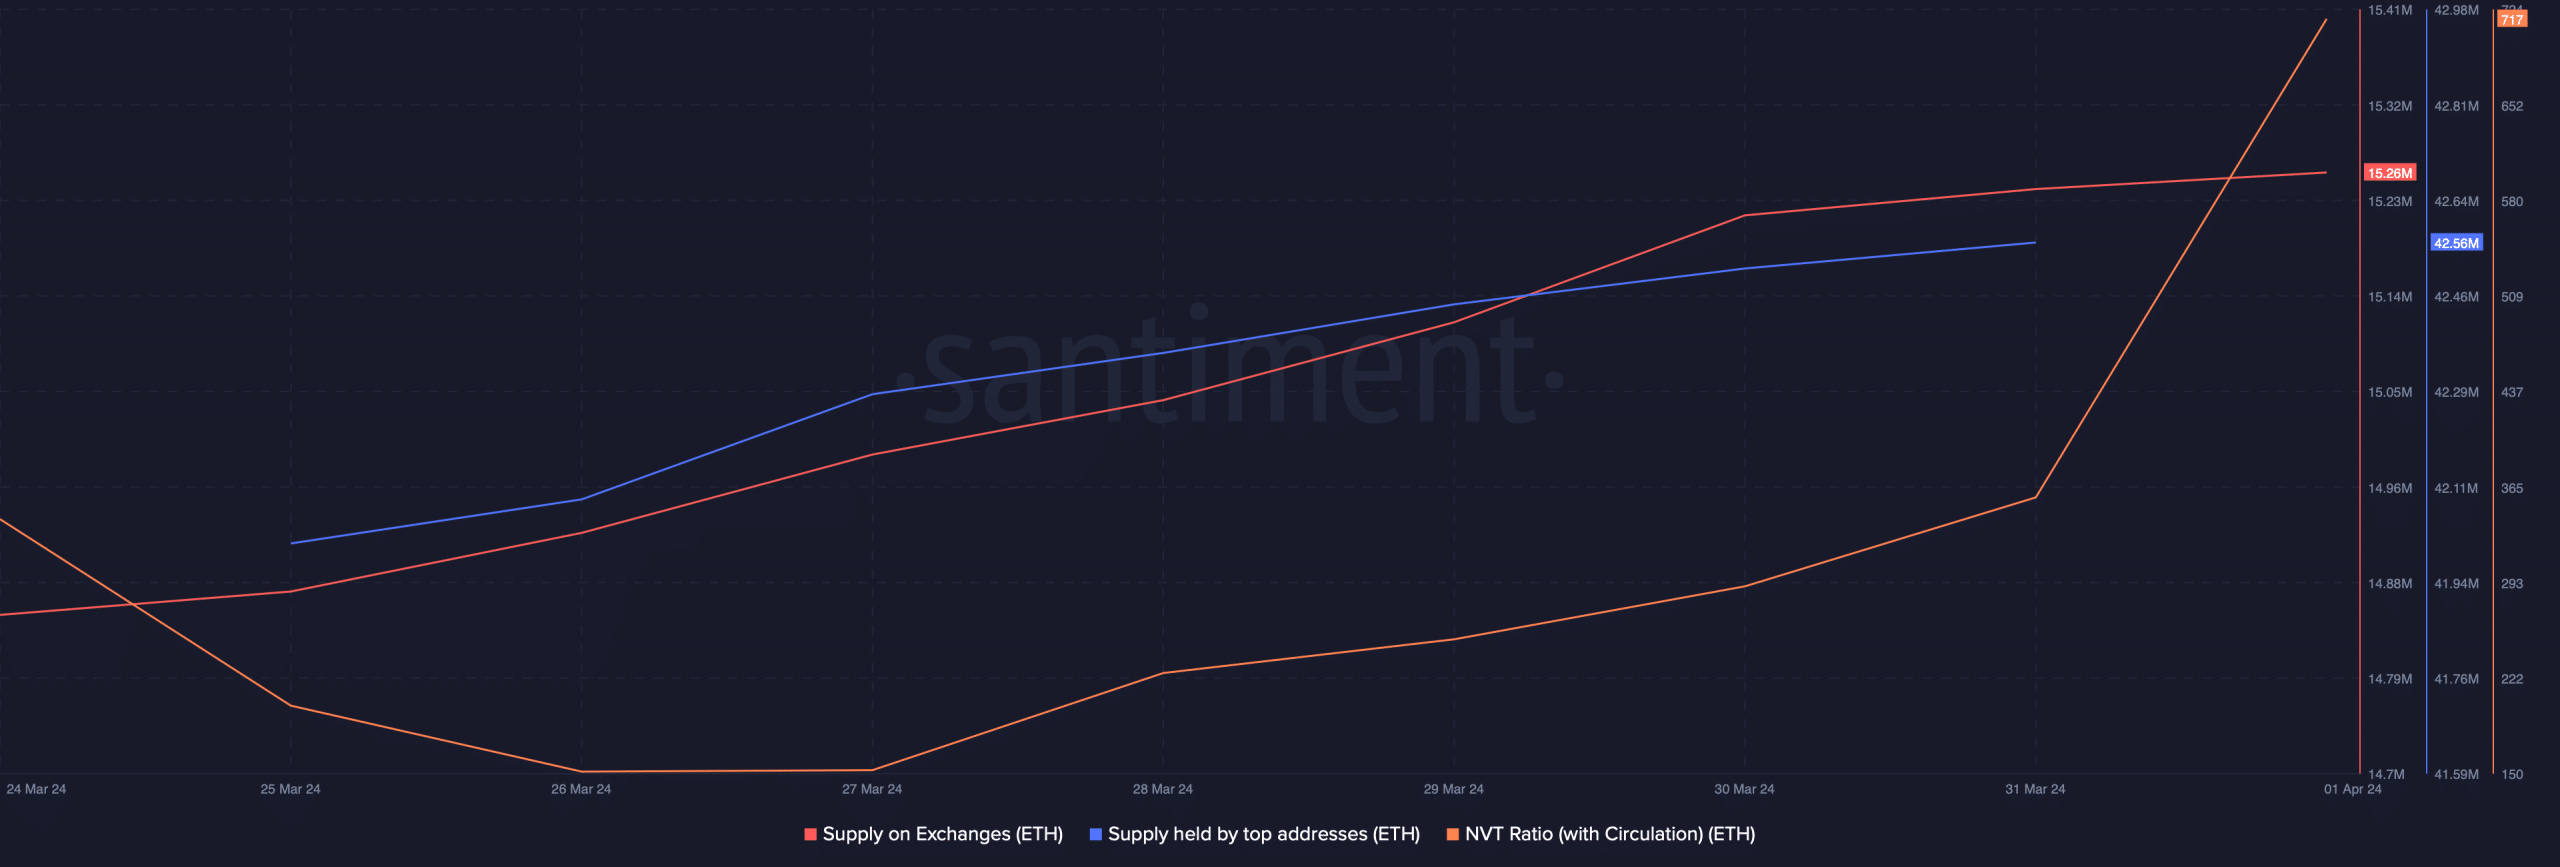
Source: Santiment
Given the token’s value decline in the past 24 hours, it’s necessary to examine its data to gauge its trend in April. Despite the increase in non-zero addresses, its supply on exchanges is still rising, indicating high selling pressure.
Related: Ethereum Targets $3000 with Positive On-Chain Signals
According to CryptoQuant data, ETH net deposits on exchanges are higher than the seven-day average, indicating that investors are selling ETH.
Interestingly, whales have shown confidence in Ethereum as its supply held by top addresses has increased. However, Ethereum’s network-to-value ratio has surged significantly.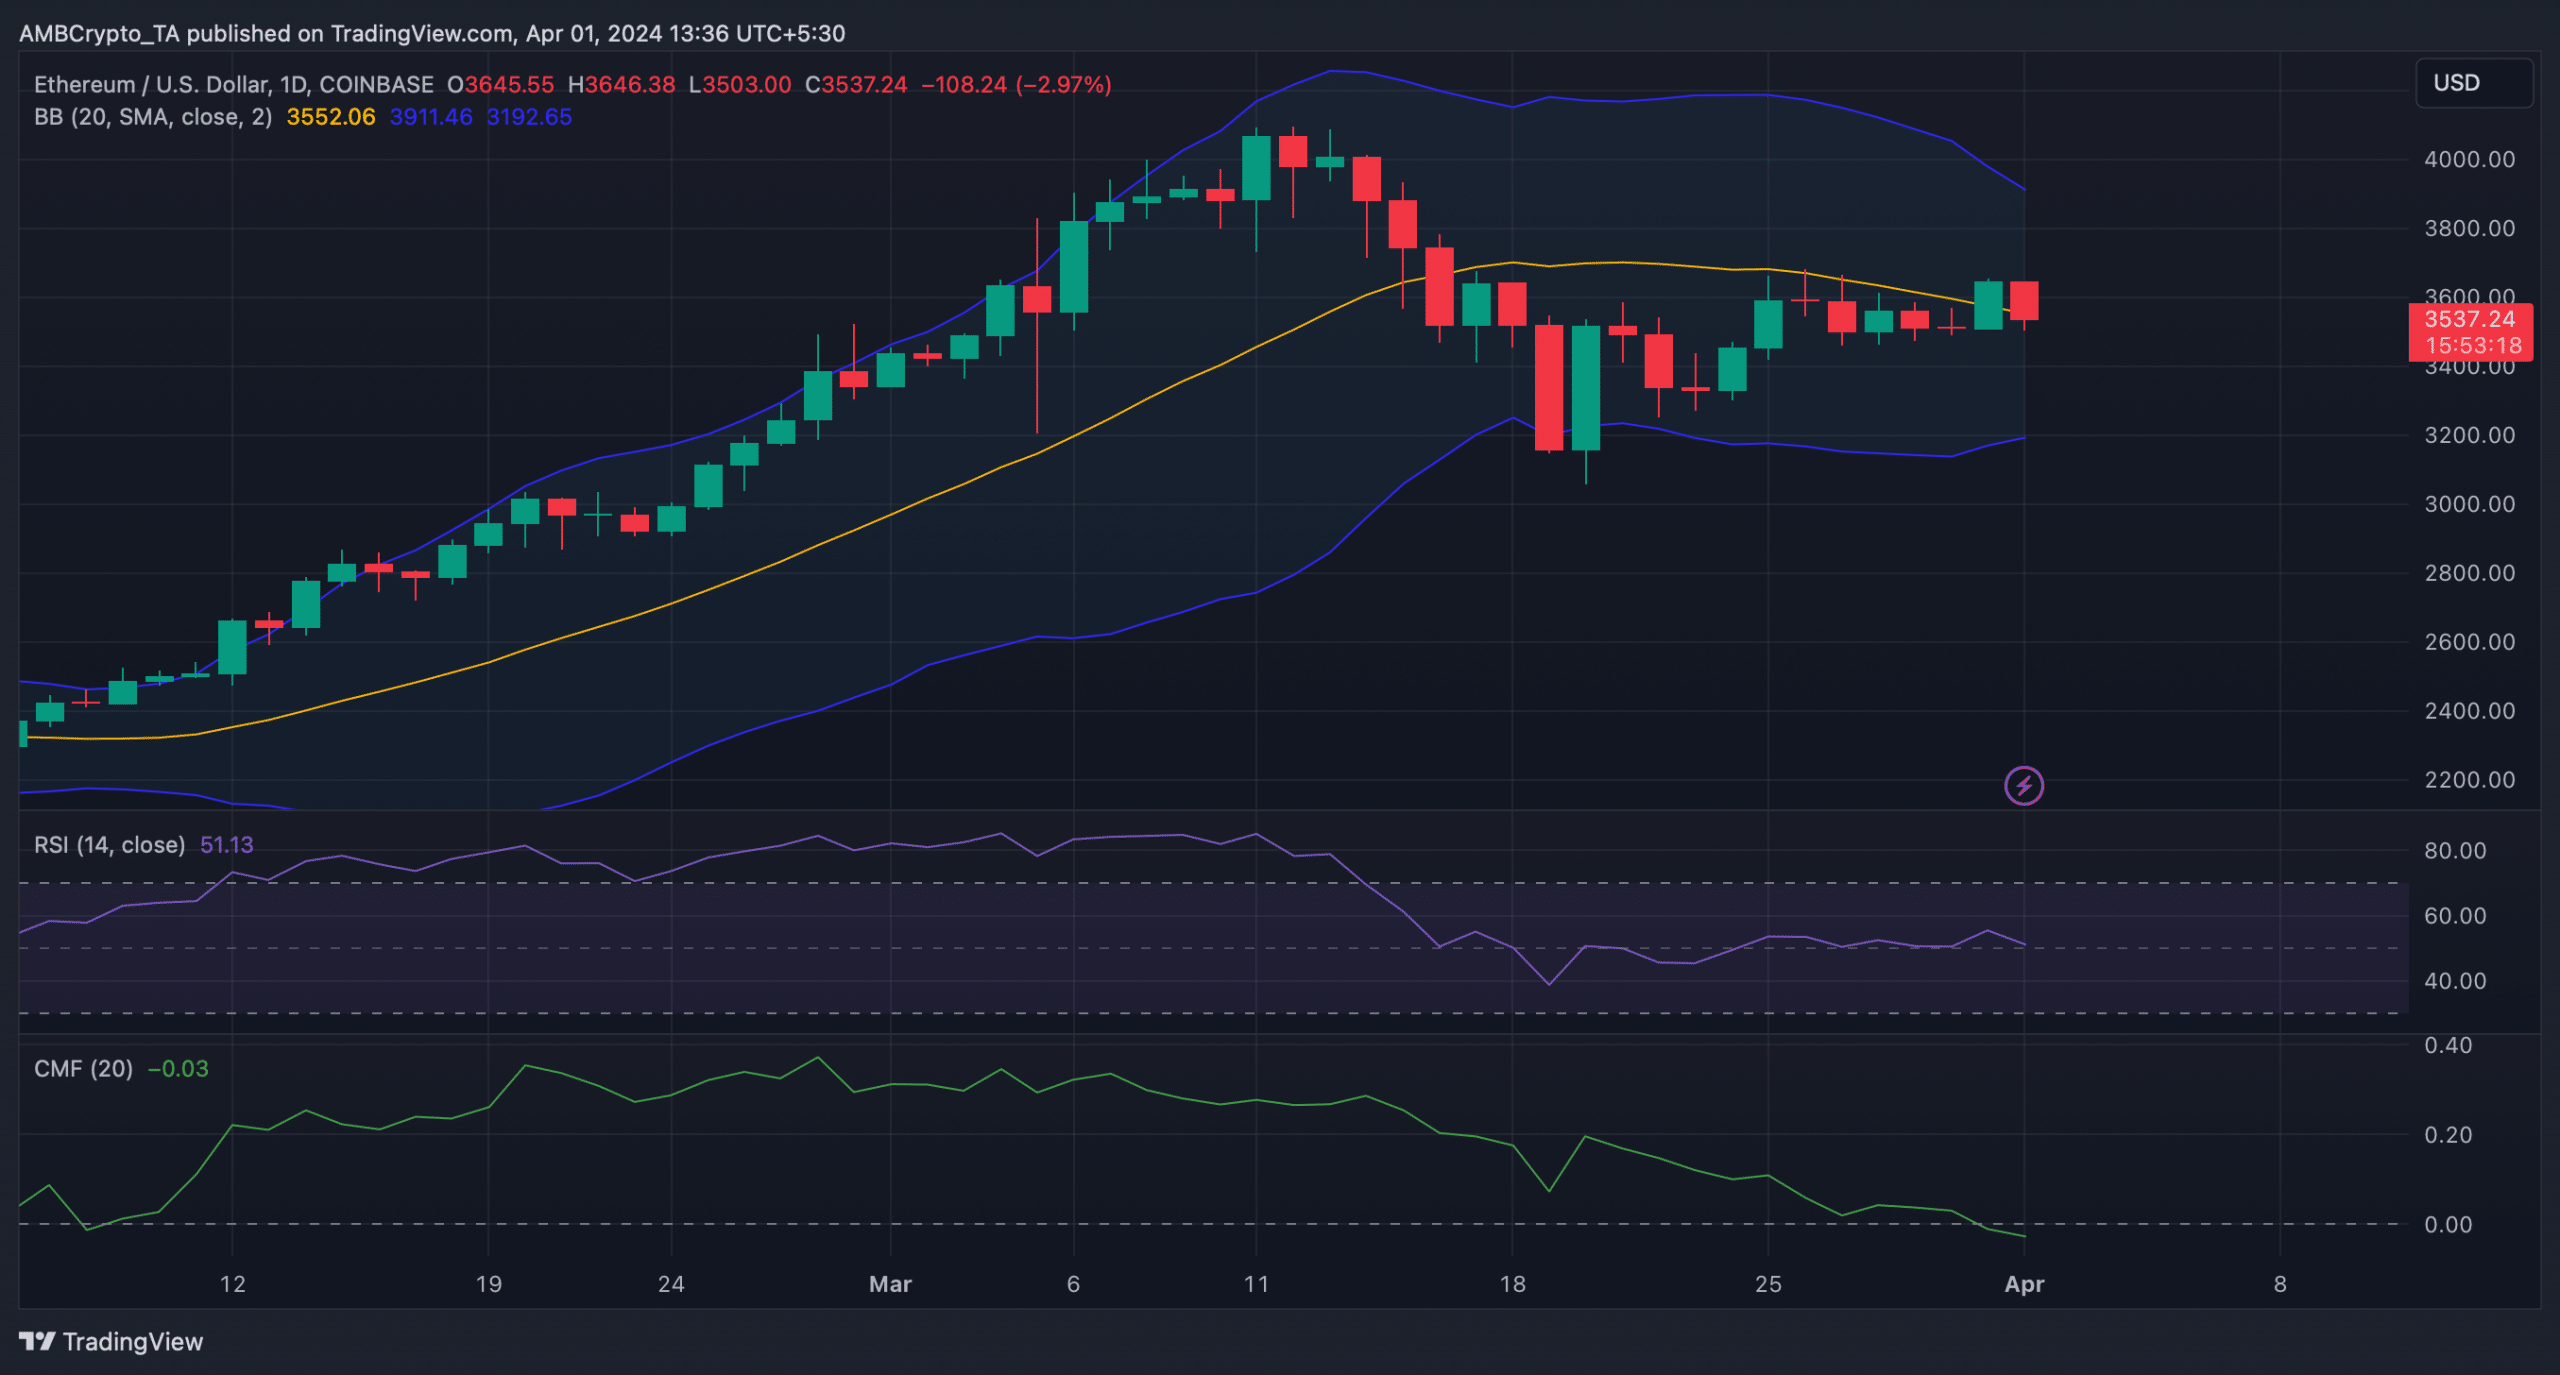
Source: TradingView
This increase indicates an asset being overvalued, suggesting a high likelihood of price correction.
Our analysis of Ethereum’s daily chart reveals that its Relative Strength Index (RSI) has trended southward from the neutral zone. Its Chaikin Money Flow (CMF) also follows the RSI, recording a sharp decline.
Furthermore, its Bollinger Bands indicate that ETH price is entering a less volatile zone, reducing the possibility of short-term price hikes.