Australian A-REITS- Fundamentals:

To start understanding what the REIT landscape in Australia, we first have to understand what a REIT is. Then, we can break down the major players and which pies their fingers are presently in.
So:
What are REITS?
Real Estate Investment TrustS (REITS) are actually two entities that are stapled together, made of:
- A trust component, which owns the properties, collects rent and is a tax pass through entity (it must distribute at least 90% of it's taxable income to unitholders)
- A company component, which manages the properties and conducts development on behalf of the trust component for a management fee
So when you purchase a share of a REIT in Australia you are actually effectively simultaneously purchasing both a trust and the management company.
Take the example of Goodman Group, whos' financial results are split into two distinct sections; Goodman the management company and Goodman Investment Trust (GIT) the trust component.
When you purchase a share of GMG on the ASX, you purchase a share of Goodman Group and a unit of GIT simultaneously.
What are Some Key Industry Metrics?
Just like any business, REITs exist to create profit for it's investors. However, given the real estate asset heavy nature of REITs, Funds From Operations (FFO) is typically used instead of EPS. FFO is calculated as
Net Income + Depreciation + Amortization - Gains on Property Sales.
Depreciation is added back in because although traditional accounting dictates that property assets depreciate over time, REIT property assets are typically comprised of properties that are expected to be appreciating in value over time, and many property types reflect this reality.
Amortization is added back in as it is an expense that doesn't reflect the actual economic performance of real estate assets.
Gains on Property Sales is taken out as property sales happen more often and represent a element of the core business of REITs as well as being often more significant financially for REITs compared to other businesses.
Adjusted Funds From Operations (AFFO):
FFO - Recurring Capital Expenditures - Leasing Costs
This further adjusts the FFO to take away recurring costs of asset maintenance. Essentially reflects the profit that is being generated from the company's assets and it's true dividend paying capacity.
Net Asset Value:
Estimated Market Value of Properties - Debt + Cash
A reflection of the underlying real estate value per share.
Net Operating Income (NOI):
Rental Income - Property Operating Expenses
This basically tells you how much income a property (or the entire trust) is generating on a marginal basis. This is important as a indicator of effective management, and you want to see NOI grow on a property basis balanced against any major renovation costs.
Capitalization Rate (Cap Rate):
Net Operating Income / Property Value
This basically shows the unlevered yield on properties - i.e. how many cents of return am I receiving for each dollar of asset. This is an important factor to assess the overall health of a portfolio and can potentially be used as a risk indicator.
Debit to EBITDA:
Total Debt / EBITDA
This is a key leverage metric that shows ability to service debt, Lower ratios indicate more financial strength and less financial risk.
Interest Coverage Ratio:
EBITDA /Interest Expense
Shows the ability of the firm to meet interest obligations with it's earnings. Higher is better, especially since REITs can be sensitive to interest rate changes.
Dividend Yield
Annual Distributions / Current Share Price
Important for REITs that are priced as fixed-income vehicles.
Occupancy Rate
% of Property Space Leased to Tenants
A key demand side measure which directly impacts revenue, with higher occupancy indicating stronger cashflow. if occupancy is low across the board you would have to reconsider the risk of assets on book being materially de-valued.
Weighted Average Lease Expiry (WALE)
Average remaining Lease Term Across Portfolio, Weighted by Rental Income.
This can be used as a proxy for the amount of roll-over risk you have, and a longer WALE indicates a more predictable future income stream. Lower WALEs means that a more significant portion of the portfolio needs to be rolled over in the near term.
Here, we're gonna take a look at a few A-REITs to get a sense of how revenue and costs are distributed, as well as what the key factors of influence may be. First up is the biggest of the bunch, Goodman Group.
Goodman Group
History:
The Goodman Group was founded in 1989 as a private property trust focused on industrial properties by Greg Goodman, the son of a food manufacturing magnate and then residential property developer in NZ. The goodman group was listed on the ASX as Goodman Hardie Industrial Property Trust in 1995 with 8 properties in Sydney and 37m AUD in market cap. Greg has been the CEO since it's inception to today, flanked by a deeply experienced executive management team (20+years). Almost all of Goodman Group's region heads have had at least 10 year tenures with the group (Asia, China, Australia, UK, NA, Brazil, Europe, Legal, Tech, Stakeholder Relations, Equities, HR, and Finance), demonstrating leadership stability and suggesting that any strategic implementation are likely to proceed more smoothly than otherwise, since all leaders are known numbers and have experience working with each other.
The trust then merged with Macquarie Industrial, which became the then largest sector-specific industrial trust in the market. The trust management companies also merged to create Macquarie Goodman Management Ltd, which managed the new Macquarie Goodman Industrial Trust.
Goodman group then expanded into New Zealand under this new trust in 2003, and the organisation changed it's name to Macquarie Goodman Group in 2005 following a string of acquisitions of industrial and logistics properties, including from the Commonwealth Property Office Fund and AMP Industrial Trust.
Goodman launched it's Australia Industrial Partnership (GAIP) in 2005, one of it's major investment vehicles in Australia, with Goodman taking a co-investment stake while serving as the fund/asset manager for the partnership's institutional investors. Around the same time, Goodman made it's first entry into the UK market, alongside partnerships in Europe and Hong Kong SAR. This would be the first of many partnerships to come, and become a cornerstone of Goodman's strategy.
Some work can be done here to identify who the major investors in GAIP are if possible.
In 2007, Goodman group entered the Japanese Market and rebranded globally as Goodman. This was followed by the Goodman China Logistics Partnership in 2008, a period of declining economic activity and low investor confidence. During this period, Goodman was able to reduce it's high gearing from 46.6% (look through) in FY 2007 to ~25% in FY 2010. Although profitability declined during this period, it ultimately remained positive for Goodman Group. However, during this period the market significantly revalued goodman group's share price, reflecting the change in its previous growth expectations.
In 2012, Goodman continued expansion into the US via the Goodman North America Partnership with an initial equity amount of US$890M with the Canada Pension Plan Investment Board (CPPIB) on a 55/45 Basis. Simultaneously, they entered into a agreement with Birtcher Development & investments for the development of Logistics and industrial facilities across NA. later on in the year, Goodman would also enter into a JV with WTORRE for the development of logistics and industrial properties. From this period we can already see that Goodman's strategies reflect their direction toward development and management, rather than simple asset acquisition and yield generation.
Goodman would continue this strategy of forming partnerships in the coming years, focusing on warehousing and logistics facilities. More recently, GMG has ramped up its development of data centers, with it's first one being built in HK in 2006, and upcoming projects in Japan, HK, and the US.
Financials
From GMG's consolidated interim 2025 financial report, we can see the reflection of this strategy. In H1 25, property investment income only accounted for 4.5% of total revenue, while development income was 78%. However, investments and management are much higher margin businesses, and still account for a higher percentage of operating earnings.
we can also see that while the GMG has expanded to overseas markets over the years, their main revenue base remains across ANZ, followed by continental Europe and Asia. Given the newly announced projects, we will expect further expansion of revenues across the Americas once construction is complete.
From the above, we get a sense that in GMG may have completed and handed over many development projects during this period, while in EU there are more ongoing development projects with revenue being recognised incrementally.
get list of companies and their splits by revenue stream.
GMG's income statement shows an interesting trend where there are massive swings in both total external revs and share of net results of equity accounted investments. Essentially, it's generated revenue seems to be extremely variable over time.
Here, it seems pretty key to understand why this might be.
GMG claims in their 2024 financial report that changing funding rates and movements in global bonds have changed property valuations, likely by reducing the operating income on the property as costs of leverage has increased. We know this puts downward pressure on all property markets as it tends to be a highly levered industry, particularly in residential real-estate. GMG maintains a lower gearing level, meaning it is less exposed to interest rate fluctuations from a operating income perspective. However, as commercial and industrial lending tends to maintain a 50-70% LVR ratio, increases in funding costs can cause significant revaluations of real estate assets, which reduced their market value. So GMG should see a net lift to their cap rate, as the deterioration in operating income should be more than offset by the depreciation in the underlying value of the assets. Net-Net, we should see this as a negative effect for GMG's valuation.
Indeed, we can see from GMG's 2024 Annual report that their cap rate has increased by 0.7% to 5.2% over FY 24 (This is approximately similar to what you could have gotten on a high interest saving account over the period, reflecting the potential unattractiveness of traditional REITs during a rate hike cycle).
Further, the group reported an approximate loss of 1.6B in revaluing their property assets and developments. Again, this matches the hypothesis above and we can see that the value of GMG's are heavily influenced by interest rates and their expectations.
Breaking down their financing as of the interim 2025 report, their assets exposure in each geography as a percent of total assets are as follows (excl GIT, incl additions) :
Interesting to note here that in the unconsolidated reports the segment numbers don't marry up to the total numbers. Although difference is minor, we should Investigate notes for details
With dollar amounts:
Here, we can see that the vast majority of GMG's business activities are concentrated in ANZ, the Americas, and Asia.
Hence, we should try to understand how these markets have trended over the past 3 years.
There are a few key factors here to consider:


- funding costs. Real-estate valuations are by nature sensitive to funding costs, So getting a understanding of how the funding trends have played out in each country is critical to understanding GMG's changes in asset value over the past 3 years
- Logistics and industrials valuations and demand
- Demand for data centers
- the ongoing trade war and it's dynamic effects on the above.
To discuss the following section, we need to find out what exact assets GMG holds in each of these countries - how can you do this?
The following represent the OCRs and segment analysis of the major locations in which GMG operate:
Australia:
When overlayed with their percentages of all properties, we get:
These properties are distributed across the east coast of Australia, with the vast majority of locations in the greater Sydney area.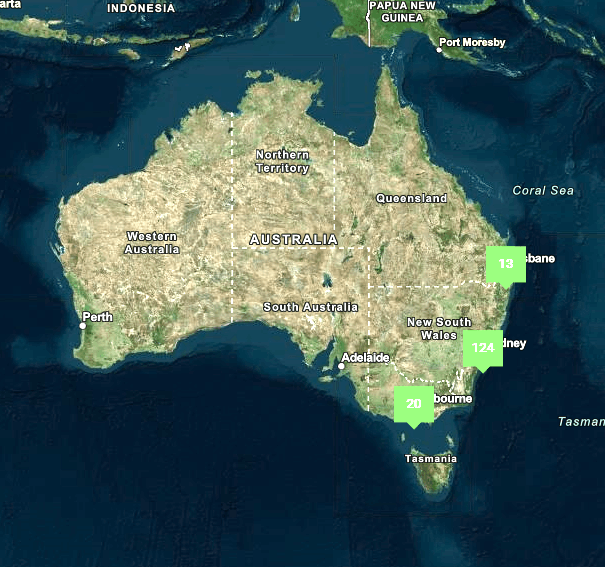
Looking back over to Q1 24, we can observe based on CBRE data that the Sydney Market remains strong.
Due to chronic undersupply for new industrial developments restricted largely by both land mass and zoning restrictions, I am of the opinion that we are unlikely to see a change in the short to medium term on the supply side. Given the robust growth in the Australian population, high building costs and home affordability crisis, Industrial zoning is likely to face continued competition from residential, with governmental policies focused on supporting homebuyers (and getting votes).
The completion of the Western Sydney Airport and the combination of higher e-commerce penetration driving demand for last-mile logistics and high transport demands for primary sectors means that demand side pressures are also likely to remain stable in the absence of a significant paradigm shift.
In light of recent events RBA signaling potential rate cuts in the case of a Global trade war. As the US closes it self off to Chinese imports, a portion of those 15% of exports will likely be distributed across the remainder of China's export markets, creating a net downward pressure on consumer prices. This is in turn likely to increase retail demand, and therefore increase the criticality of logistics infrastructure, potentially allowing for increased rental growths.
Further, CPI has been returning to the target band of 2-3% net of these external economic effects and there are baseline expectations of a cut cycle in the near future.
All of the above combined signals material tailwinds to GMG's Australia property portfolio. Although there will be a mathematical deterioration in cap rates, investors would hardly complain as this comes from a capital appreciation of the underlying property assets. Further, as funding costs reduce and demand continue to outpace demand, market rental growth may accelerate.
One thing to note here is that there are reports of third party logistics providers being priced out of logistics and warehousing in Sydney. Despite this potentially being true, Sydney remains one of Australia's largest markets, and it is thus difficult to see demand for last-mile logistics or warehousing facilities deteriorating. All this means is that there may be a potential cap on the rate of growth.
The above could be a significant concern, depending on how the market has currently priced GMG.
Additionally, GMG has began the process to approve the development of project Apollo, a 80MW data center in Macquarie park.
Some estimates have quoted this at approximately ~2B end value, but this will be explored further during the forecast and discussion on pipelines.
In summary, without knowing how much of the above has been priced in by the market, I remain bullish on the performance of GMG's Australian based portfolio in the near to mid term. Further expansion into Melbourne and Brisbane at attractive entry rates would be viewed favorably.
New Zealand:
Despite vacancy rates marginally rising over the previous 6 months to February 2025 GMG only has 1 lease availability across it's property portfolio here.
Overlaying the distribution of Goodman's property portfolio with the performance map provided by Colliers, you can see that The Majority of GMG's properties are in the south western precinct, tracking declining Prime average Market Yield, which remains around 5.5%, increasing vacancy rates, and flat land values. This is reflective of a larger property market downturn, which had been coming off exuberant highs that peaked toward the end of 2021.
Increasing sublease space is also a negative indicator for the market, alongside softening end-user following a prolonged period of underwhelming economic growth. However, there are some signs of economic recovery, such as the continued RBNZ rate cuts and an inflection in MPI growth. I am tentatively bullish on GMG's NZ portfolio, supported by it's low vacancy rates and the criticality of interest rate movements on property values. A sustained expansion in real consumer spending would strengthen my conviction.
Nominal Consumer Spending: 
US:
The US will be a core aspect of GMG's strategy, indicated by their 61% increase in assets in the Americas over the 6 months ending Dec 31 2024, increasing it's asset holdings to over $8B AUD. More recently, GMG has announced the commencement of it's 49.5 MW data center LAX01 in Vernon, California as a part of it's 10B global data center roll out plan.
GMG has 35 properties in the US (36 including the new data center), which are distributed as follows:
Again, we can see heavy portfolio concentration toward Industrial developments. Goodman's portfolio in the US is largely distributed along the east and west coast, with significant concentration in California and in Pennsylvania, New Jersey and NY on the east coast.
California has seen slowing population growth since at least 2000, with a net decline in population from 2020 through to 2023. However, population growth inflected in 2023-2024, and is now slightly positive. Median incomes across the state have also seen steady growth. 


- Immediate price inflation, as the cost of imports and supply increase
- Rates increase / delayed cutting cycle, as inflation rises. Business adjust based on changes in demand and supply
- Potential deflationary pressures if demand collapses
- Ongoing long-term inflationary pressure if demand remains robust, as the country systematically loses access to cheap labour and manufacturing inputs.
Regardless, these will be systematic headwinds for the sector, as either increases in the cost of funding or collapse in domestic demand e.g. 1930 will soften demand for property and subdue property values, although an inflationary case here will be significantly better, as property values may nominally increase, offsetting some of the effects of rate hikes.
For LA, where around half of GMG's Cali portfolio is located, we see that vacancy rates are at 6%, with a declining 12-monthly net absorption, having declined for 11 consecutive quarters. This has caused a declining trend in rents, having fallen 4% YOY, steadily declining since q4 2023. Cap rates in the region remain relatively high at 5.1%, however, this is a mathematical effect due to a decline in asset valuations, in the range of 8% (MATTHEWS 2023, 2025)
The other approximately half of GMG's Cali portfolio is located in Inland Empire, where the rents are significantly cheaper, and the average cap rate is 4.6%. Although this area has been positive net 12-month net absorption, mainly due to shifting demand from central LA, vacancy rates remain relatively high at between 7-8% depending on estimates).
Overall, we see a downward trend coming into Q1 25 in these key locations, and with the macroeconomic uncertainty that is facing both consumers and businesses in the US, it is difficult to take a bullish view here. Although imports at the port of LA has remained robust, we have seen a 15% decline in loaded exports. Further, there is a popular theory of consumers and businesses 'front-running' tariffs, which may have inflated the import numbers. As net imports usually recover in April, the container statistics for April will be critical to determining the real impact of the tariffs on trade, and thus logistics facilities at these major hubs.
Now on the other side of the coast, although NY has seen some demand tailwinds due to proximity to population centers and port capacity expansion that have shifted imports east

There have also been some reports that shipments have started shifting back west, so we'll have to see how these numbers unfold in the coming months. Next steps here would be to take a deep dive on port and real-estate data across each of GMG's operating regions.
As the development of AI and other cloud technologies continue to progress, the vacancy rate of Data centers across North America continue to trend downward. The data will need to be re-evaluated closer to completion, but GMG's Vermont development should be coming into strong demand if present trends continue.
Next steps here are to gather additional data on the number of data centers being built across NA, their development schedules, and their impacts on the supply and demand dynamic.
In summary, what would have been a bullish period of valuations recovery for GMG's US assets have been overshadowed by the potential of the ongoing trade war. While it's exact effects remain to be seen, we know that sentiment is down across the board, and I remain Bearish in the short to medium term, noting uncertainty around whether this represents a temporary or a structural change for the US economy.
Brazil:
Consequently, this means that despite the mass of GMG's operations within Brazil and the headwinds their property portfolio has been experiencing (high net absorption, declining vacancy rates), they make up an immaterial part of GMG's overall operations, and thus will be passed for in-depth analysis.
Further steps here are to understand the P/SQM for each jurisdiction, and weigh the different locations by segments. We already have some measure of this from the segment reporting that GMG releases.
Hong Kong:
GMG's HK portfolio consists of 11 Logistics centers and 1 data center. It's properties here are a little taller than in other locations, reflecting the scarcity of land that is characteristic of HK.
HK has similarly seen an increase in vacancy rates across the board in the logistics sector since 2022. This is reflective of the various industry headwinds that have plagued the region in recent years.
Another point of note is that HK's data center vacancy rates had surged to around 30% in Q1 2024 due to surges in supply. This serves as a warning of what could happen in other regions if data center development pipelines mature in close proximity, though we may see this vacancy rate come down as geo-political tensions stabilise, noting that Beijing likely has a tight leash on what services are able to be routed through HK, and increasing demand for AI capability over the last year.
Japan:
Japan represents a very interesting portion of GMG's portfolio, having recently come out of a decades-long period where interest rates were 0, then negative. This had resulted in historically low funding costs, with Japanese corporate bonds often yielding a coupon rate of around 1%. The change in this dynamic is also what caused the popular basis trade to unwind mid last year.
Unsurprisingly, GMG's Japan portfolio is focused around two of Japan's major bays, Tokyo and Osaka.
Including the ____ that is being developed, GMG currently has 20 Properties across japan, with 10 in Tokyo and 10 in Osaka*.
Again, the vast majority of these properties consist of business parks and industrial facilities, with the entirety of GMG's Tokyo offering being industrial facilities. JLL Tokyo has a very interesting dynamic in it's logistics market, with demand concentration extremely high, around Chiba bay due to local labour laws and cost dynamics. Within Toyko, only two of GMG's facilities have advertised vacancy, despite reported vacancies for sub-prime locations sitting at ~10%. We can see this reflected even within GMG's portfolio, with both of the leasable properties being in Joso.
An interesting point of note here is Japan's population decline. Although this is a longer-term issue, over the next 20 years Japan's population is expected to halve. Conventional wisdom would suggest that while property prices in urban centers like Toyko and Osaka may remain resilient, an aging population will inevitably cause changes in consumption trends. Find out here what effects this have had on property prices in the past.
In tokyo we know that transactions volumes have been increasing and that the value of land in Tokyo and Osaka have increased for the 4th year in a row. The rate of increase has widened in these two cities, while the rate of increase in Nagoya has slowed down. Here, it would be prudent to find out whether Nagoya acts as a leading indicator for Tokyo and Osaka, or whether that declining population means ongoing population consolidation, meaning that smaller locatillities will perform differently.
China:
Europe:
UK:
Note here that vacancy rates can be tracked live via a webscraper that crawls through the GMG website to identify the locations that are up for lease, their location, nature, and their square footage.
Here, we can see that interest rates began trending upward in Dec 2021, peaking in Aug 2023 and easing from Aug 2024.
next steps: Understand the capital structure, their pipelines and how this has affected the financial statements,
There are claims from Morningstar that data centers make up over half of goodman's development pipeline. Validate this claim. If true, then any analysis will need to track data centers pretty closely.
Goodman has performed so well in recent years that it now comprises around 40% of Australia’s real estate index validate this claim, big if true because goodman isn't a traditional REIT.
need to validate these reports from morningstar - what other hedge funds and mutual funds are overweight goodman? how much of the investment is institutional investment? what are their risk mandates and acceptable losses? what do their profit taking motive / liquidation requirements look like?
understand why there' such a big discrepancy between rev and operating income figures
Understand what markets usually value REITs on (compare with GMG),
Understand what the biggest costs for REITS are (compare with GMG)
Understand what the industry standard is for operating revs(compare with GMG).
Understand what the biggest risk factors for future strategy are.
what do I need to understand to value the stock?
What is goodman's strategy?
What are their primary revenue streams?
what do Markets value them on? why?
What are their biggest costs?
Hence, what are the most important things to watch out for?
Scentre, on the other hand, trades much more like a trad reit, with the net divident yield on its share pricce being around 5%. This is a share that you can value more on FFO
Share of net results of equity accounted investments
Operating earnings per security were up 14%
-need to understand
what multiples are used
what is industry standard
Note: this note will be updated over the next few days.