The Architectural Mechanics of Financial Markets And whale's Mindset

Introduction: The Hidden Mathematical Matrix of Capital
Every single day, trillions of dollars pass through global financial conduits. Stock markets experience volatile swings, traditional paper currencies silently lose their purchasing power, and digital assets like Bitcoin (BTC) print massive green and red candles on trading dashboards. To the untrained eye of a retail trader or a beginner, these erratic price movements appear as pure, unadulterated chaos. They look like a digital casino governed by luck, social media hype, or random chance.
However, behind this veil of apparent madness lies a beautifully structured, rigid economic and mathematical matrix. Every market movement is governed by two immutable laws: Demand and Supply . Whether it is the ancient commodity markets, Wall Street’s stock exchanges, or the ultra-modern decentralized Web3 ecosystem, price is simply a real-time reflection of the tug-of-war between buyers and sellers.
To truly understand market mechanics, master spot trading, and decipher how institutional giants manipulate price action, we must remove complex corporate jargon. Instead, let us look at a simple, real-world village market scenario. By establishing five foundational economic rules through this analogy, we can map these exact principles onto advanced trading indicators like the Relative Strength Index (RSI), institutional order books, and the macro-dynamics of Bitcoin.
Part 1: The Village Sugar Shop Analogy (The 5 Golden Rules of Market Dynamics)
Imagine a self-sustaining, isolated village consisting of exactly 200 residents. In this village, there operates only one single grocery storefront that holds a absolute monopoly over the local sugar trade. To maintain their nutritional equilibrium, each individual villager requires exactly 1 packet of sugar for their daily consumption. Therefore, the aggregate baseline demand of this entire micro-economy is mathematically locked at exactly 200 packets of sugar.
Let us observe how the changing inventory of this single shop completely dictates the market price of sugar and governs the behavioral psychology of the villagers.
+-----------------------------------------------------------------------+

|                      ECONOMIC DYNAMICS MATRIX                         |
+---------------------+------------------------+------------------------+

| CONTEXTUAL SCENARIO | DEMAND VS SUPPLY VALUE | QUANTIFIABLE PRICE     |
+---------------------+------------------------+------------------------+

| Perfect Equilibrium | Supply: 200 Packets    | Stable Baseline Cost   |
| (Rule 1)            | Demand: 200 Buyers     | (No Fluctuation)       |
+---------------------+------------------------+------------------------+

| Continuous Depletion| Supply: Decreasing     | Organic & Continuous   |
| (Rule 2)            | Demand: Fixed at 200   | Out-bidding Escalation |
+---------------------+------------------------+------------------------+

| Syndicate Monopolization| Supply: Hidden (80 on shelf)| Artificial & Abrupt |
| (Rule 3)            | Demand: 200 Buyers     | Speculative Spike      |
+---------------------+------------------------+------------------------+

| Supply Flood / Crash| Supply: Excess (300)   | Aggressive Discounting |
| (Rule 4)            | Demand: Dropped to 100 | Market Crash           |
+---------------------+------------------------+------------------------+

| Absolute Hard Cap   | Supply Limit: 500 Max  | Macro Scarcity &       |
| (Rule 5)            | Demand: Dynamic        | Parabolic Valuation    |
+---------------------+------------------------+------------------------+
Rule 1: Market Equilibrium
If the store owner calculates his consumer market perfectly and imports exactly 200 packets of sugar, an ideal economic state is achieved. Here, Supply perfectly matches Demand. Every resident who leaves their home to purchase sugar receives exactly one packet. The shopkeeper is left with zero dead inventory, and no buyer is left empty-handed. Because there is neither a supply deficit nor a surplus glut, the price of sugar remains perfectly static and fair. In macroeconomic academia, this balanced state is defined as Market Equilibrium.
Rule 2: Continuous Depletion and Organic Volatility :-
Now, consider a standard business day. The store opens with 200 packets on the shelves. As morning turns to afternoon, 100 villagers line up and purchase 100 packets. The total available circulating supply inside the storefront rapidly drops to 100 packets. However, there are still 100 villagers waiting outside who have not secured their daily share.
As the physical inventory on the counter thins out, psychological anxiety strikes the remaining crowd. Realizing that the available supply cannot satisfy the remaining demand, the subjective value of those last 100 packets spikes. Villagers willingly offer more money to outbid their neighbors, forcing the shopkeeper to raise the price. This price appreciation continues organically until a new wholesale shipment arrives to re-supply the shelves.
Rule 3: The Syndicate Protocol and Market Manipulation :-
What happens if the shopkeeper turns greedy and decides to exploit the village to extract maximum profit margins? He initiates a financial maneuver known as a Syndicate
The shopkeeper possesses the capital and has successfully imported the full 200 packets into his back warehouse. However, he intentionally conceals 120 packets from public view, locking them deep inside his vaults. He places only 80 packets on the shop counter and announces a severe supply crisis.
Visually, the villagers only see 80 available products for 200 hungry consumers. This engineered supply shock causes massive panic. Fearing starvation, the villagers enter a bidding war, paying 200% to 300% premiums for a single packet. Through this artificial liquidity crisis, the market manipulator extracts massive wealth from the community while holding the actual asset supply in reserve.
Rule 4: Demand Collapse vs. Supply Flood :-
Markets do not just climb; they can crash with extreme velocity. Let us examine a negative psychological shift. Suppose a prominent health official circulates a medical flyer through the village, and 100 out of the 200 residents instantly quit consuming sugar for health reasons. The shopkeeper still has 200 packets on display, but his buyer pool has collapsed to 100 people.
Alternatively, consider a situation where the village demand remains at 200, but the shopkeeper miscalculates and floods his shelves by importing an excessive 300 packets of sugar.
In both independent scenarios, the underlying economics match: Supply aggressively outweighs Demand. The shopkeeper is now holding expiring, overstocked inventory. To clear his counter and recover his basic operational capital, he is forced to drop his prices, causing a severe market crash.
Rule 5: The Fixed Architectural Cap:-
Every physical or digital economy has an ultimate structural boundary. In our analogy, let us assume that the primary wholesale distribution refinery from which the shopkeeper sources his sugar operates under a hard physical constraint. They absolutely cannot manufacture more than 500 packets of sugar in total, regardless of global financial demands.
This means that no matter how chaotic, speculative, or manic the day-to-day trading behavior of the 200 villagers becomes, the absolute macro-boundary of this economic landscape is permanently capped inside that 500-packet limit. Every local price fluctuation must resolve itself strictly within the parameters of this fixed maximum supply.
Part 2: Translating the Analogy to Crypto (Spot Trading & Volatility)
Why is this village sugar shop analogy so vital? Because the global Bitcoin market operates exactly like this sugar storefront, just amplified onto a multi-billion-dollar digitized scale.
When you open a crypto exchange layout and analyze a Spot Trading pair like BTC/USDT, you are looking at a digitized version of that village counter.
- The Order Book represents the shop counter.
- The Bids (Buy Orders) are the villagers standing in line with fiat capital.
- The Asks (Sell Orders) are the sugar packets sitting on the digital shelves waiting for immediate execution.
The sharp, sudden price actions in cryptocurrency—collectively known as Volatility —occur for the exact reasons outlined in our five village rules. If thousands of retail investors or institutional funds suddenly decide to buy Bitcoin simultaneously, they wipe out the available sell orders on the exchange ledger. The circulating supply instantly depletes (just like the sugar packets dropping from 200 to 100), creating an organic price squeeze that drives valuation upward. Conversely, if bad news hits the media, buying bids instantly vanish, sellers dump their assets onto the book, supply floods the exchange layout, and the market crashes.
Part 3: The Technical Blueprint – Decoding the RSI (Relative Strength Index)
To track these aggressive shifts in demand and supply without getting lost in market noise, professional traders utilize a mathematical momentum oscillator known as the RSI (Relative Strength Index).
The RSI maps market momentum on a scale from 0 to 100. Instead of looking at it as an arbitrary chart line, professional market participants view the RSI as a real-time thermometer measuring Market Psychology, Liquidity Concentrations, and Order Book Dynamics.
+-----------------------------------------------------------------------+

|                       RSI ZONE BLUEPRINT                              |
+-------------------+--------------------+------------------------------+

| RSI VALUE RANGE   | METRIC CONDITION   | SUGAR SHOP RELATIONSHIP      |
+-------------------+--------------------+------------------------------+

| 70 and Above (70+)| Overbought Zone    | Peak FOMO: 200 buyers        |
|                   |                    | fighting for 80 packets      |
+-------------------+--------------------+------------------------------+

| 41 to 69          | Medium / Trend Zone| Equilibrium shifting based   |
|                   |                    | on organic micro-trends      |
+-------------------+--------------------+------------------------------+

| 30 to 40          | Oversold Zone      | Panic Mass Sell-off: Shop    |
|                   |                    | flooded with unwanted stock  |
+-------------------+--------------------+------------------------------+
1. The Oversold Zone (RSI 30 - 40) – The Sugar Flood
When the RSI drops down into the 40 or 30 territory, it indicates that the financial asset has drifted into the Oversold Zone. This maps perfectly with Rule 4 of our village storefront.
In this structural zone, extreme negative market sentiment, bad news, or mass panic has forced the herd to sell off their Bitcoin simultaneously. The exchange order books are heavily flooded with liquid supply, while consumer buying interest has completely evaporated. Because supply is high and demand is non-existent, the price is driven down to deeply discounted, fundamentally undervalued levels.
2. The Overbought Zone (RSI 70+) – The Synthesized Peak
When the RSI momentum line breaks above the 70 threshold, the asset enters the Overbought Zone. This is the digital manifestation of Rule 2 and Rule 3 combined.
The market enters a state of psychological mania known as FOMO (Fear Of Missing Out). Thousands of emotional retail buyers compete to purchase a rapidly shrinking pool of liquid Bitcoin. Demand completely overrides available supply. The exchange order books are cleared out of sell orders, forcing the price to jump to highly overextended, premium prices.
3. The Medium & Trend Zones (RSI 41 - 69) – The Battlefield of Churn
The middle territory of the RSI represents the core ground where macroeconomic trends develop:
- Up Trend (RSI 50+): Buyers control the baseline, steadily absorbing incoming sell orders.
- Down Trend (RSI 50-): Sellers maintain structural control, slowly out-supplying the available buying bids.
While emotional retail traders buy when the market looks green and exciting (at RSI 70+) and sell when things look terrifying (at RSI 30), experienced, professional Spot Traders execute the exact opposite strategy. They wait for the market to flush down into the Oversold Zone (RSI 30-40) to build their long-term Entry accumulation positions at a heavy discount. Then, they systematically distribute their assets and take their Exit profits when the crowd enters a buying frenzy in the Overbought Zone (RSI 70+).
Part 4: The Great Macro Mystery – Why Does Bitcoin Constantly Scale Upward?
Let us address a profound economic puzzle. If a financial asset operates purely on the mechanical laws of demand and supply, its long-term chart should theoretically resemble a permanent horizontal range. The price should simply fluctuate back and forth between a fixed high point and a fixed low point indefinitely—pumping during a temporary shortage, and crashing back down to base levels during a supply surplus.
Yet, when we look at the historical lifetime macro-chart of Bitcoin, we observe a completely different phenomenon. Despite enduring multiple brutal 80% multi-year bear market crashes, Bitcoin’s macro-structural trend has spent over a decade making higher lows, scaling upward, and breaking into new price frontiers over long horizons.
Macro Price ($)
  ^

  |                                                  / [New All-Time High]
  |                                                 /
  |                             / \                /

  |                            /   \              /
  |            / \            /     \            /
  |           /   \          /       \          /

  |    / \   /     \        /         \        /
  |   /   \_/       \      /           \      /
  |  /     [HL]      \    /             \    /

  | /                 \  /               \  /
  |/                   \/                 \/
  |                   [HL]               [HL]
  +------------------------------------------------------------> Time (Macro Scale)
  *HL = Higher Low established after systemic Whale Accumulation Traps.
Why does this happen? What is the hidden macroeconomic variable that breaks the repetitive horizontal loop? The answer lies inside a dark systemic monetary reality and an institutional phenomenon known as The Whales' Accumulation Trap.
Part 5: The Whales' Trap and the Mechanics of Institutional Liquidity Sweeps
To understand why the macro trend scales upward, we must first define the players: Who are the "Whales" ?
In global finance, a Whale is a collective term for ultra-high-net-worth sovereign individuals, billionaire technology founders, massive hedge funds, corporate treasuries, and global asset management firms. We are talking about corporate entities like MicroStrategy (holding over 250,000 BTC as an alternate treasury reserve), Tesla, Space-X, and Wall Street titans like BlackRock and Fidelity.
These elite institutions operate with a completely different multi-decade timeline compared to the average retail trader. Macroeconomic wealth distribution metrics indicate that an estimated 90% of the world's liquid capital and physical wealth is heavily concentrated within these elite institutions, leaving the remaining global population to compete over the remaining 10%.
The Anatomy of a Liquidation Hunt
The Whales' Trap is a highly coordinated psychological chess game that flips Rule 3 (The Sugar Syndicate) on its head.
In a traditional village market, a syndicate hides supply to push prices up. But an institutional Whale wants to acquire as much Bitcoin as humanly possible at the absolute lowest entry cost. Therefore, they execute an Inverse Syndicate Protocol:
[Whale Institutional Spot Sell Order]

                 |
                 v
[Artificially Triggers a Price Drop in Medium Zone]
                 |
                 v
[Retail Traders Panicking / Entering Short Positions]

                 |
                 v
[Forced Liquidation of Over-leveraged Retail Accounts]
                 |
                 v
[Mass Domino Effect of Market Sell Orders (Stop Hunting)]

                 |
                 v
[RSI Flushes into Deep Oversold Territory (RSI 30-40)]
                 |
                 v
[Whales Open Trillion-Dollar Buy Walls to Absorb Cheap Supply]
                 |
                 v
[Liquid Supply Completely Stripped Off Exchanges ---> Parabolic V-Shape Recovery]
This structural loop explains the exact mechanics behind The Whales' Trap:
- The Intended Trigger: When Bitcoin is consolidating within the Medium or Trend RSI zones, a Whale or a cartel of institutions will drop a massive spot sell order onto the market layout. They do not do this to exit crypto forever; they do it to break structural chart supports and induce panic.
- The Retail Panic Cascade: Ordinary retail traders open their portfolio dashboards, see a sharp red candle, and panic. Driven by the fear of losing their capital, millions of retail investors panic-sell their spot positions directly into the declining market.
- The Leverage Trap: The scenario turns catastrophic for Future and Leverage Traders. Because a vast majority of modern retail participants trade with high leverage (5x, 10x, or 50x positions) to chase quick riches, they completely violate the core laws of risk management. When the Whales push the price down just a few percentage points, these leveraged positions hit their Liquidation Price or their Stop-Loss triggers.
- Stop Hunting and Liquidity Sweeps: When a long leverage account faces liquidation, the exchange's automated risk engine instantly executes a massive market sell order to close out the position. This triggers a cascading domino effect of forced liquidations—known in institutional finance as Stop Hunting or a Liquidity Sweep. This mechanical selling pressure drives the RSI directly down into the deep Oversold territory (RSI 30-40).
This is the exact moment where the trap snaps shut. While the retail crowd is panicking, booking losses, and declaring crypto dead, the Whales open their massive corporate buy walls. They silently and systematically absorb every single satoshi being forcefully sold by the market liquidations. They buy up all the cheap Bitcoin, stripping the liquid supply off the exchange order books and moving the coins into cold storage. With no selling supply left on the counter, even a minor wave of buying demand causes the market to establish a macro Higher Low and launch into a parabolic upward recovery.
Part 6: The Long-Term Matrix – Wyckoff Accumulation
This institutional behavior is not random; it follows a well-documented market cycle known as the Wyckoff Method, created by legendary technical analyst Richard Wyckoff. The market moves through four distinct phases continually orchestrated by the "Composite Man" (the Whales):
         (Phase C: Spring/Whale Trap)      (Phase D: Markup)
                    / \                         /\
                   /   \                       /  \
  -----           /     \                     /    \
 /     \         /       \                   /      \
/       \_______/         \_________________/        \ [Phase A: Distribution/Top]
[Phase A: Selling Climax] [Phase B: Accumulation]- Phase A (Distribution & Markdown): Whales distribute their coins to greedy retail buyers at high prices (RSI 70+), then allow or force the market to drop.
- Phase B (Accumulation & The Spring): The price trades in a boring horizontal range. Whales slowly accumulate coins while retail traders lose patience.
- Phase C (The Spring / The Whales' Trap): A sudden, terrifying price drop breaks below all support levels, wiping out remaining retail stop-losses and liquidating leveraged longs. This is the ultimate "Whales' Trap" that captures the absolute maximum amount of cheap liquid supply.
- Phase D & E (Markup & Parabolic Run): With exchange supply completely exhausted, the Whales pump the asset into a massive bull run, forcing the same retail traders to buy back in at much higher prices.
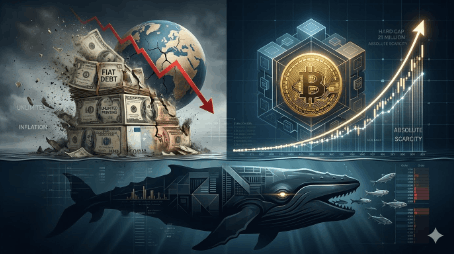
Part 7: Fiat Collapse vs. The Absolute Scarcity of Bitcoin
We now arrive at the ultimate macro climax of our economic thesis. Why do institutions like BlackRock, Fidelity, and MicroStrategy spend billions of dollars executing these complex accumulation traps just to hold Bitcoin? Why are they moving their capital completely out of traditional assets?
The answer is simple yet definitive: The global fiat currency system is trapped in a mathematically guaranteed death spiral.
For decades, centralized governments and central banks have printed paper money (USD, BDT, Euro) completely out of thin air. Whenever a nation faces a banking crisis, a sovereign debt ceiling emergency, or economic mismanagement, politicians print more currency units. We have witnessed the catastrophic end-point of this unlimited printing in nations like Zimbabwe and Venezuela, where hyperinflation completely destroyed the life savings of millions of citizens, turning fiat paper currency into literal trash. Even the US Dollar has lost over 95% of its purchasing power since the creation of the Federal Reserve.
+-----------------------------------------------------------------------+

|                    FIAT CURRENCY VS BITCOIN PROTOCOL                  |
+----------------------+-----------------------+------------------------+

| SYSTEM SPECIFICATION | CENTRALIZED FIAT COST | BITCOIN DIGITAL GOLD   |
+----------------------+-----------------------+------------------------+

| Supply Elasticity    | Infinite / Unlimited  | Hard-Capped permanently|
|                      | Political Printing    | at 21,000,000 Max      |
+----------------------+-----------------------+------------------------+

| Production Cost      | Near-Zero (Digital    | Massive Proof-of-Work  |
|                      | keystrokes / Paper)   | Thermodynamic Energy   |
+----------------------+-----------------------+------------------------+

| Long-Term Valuation  | Guaranteed Fractional | Geometric Macro        |
|                      | Depreciation          | Appreciation           |
+----------------------+-----------------------+------------------------+

| Structural Governance| Politically Controlled| Fully Decentralized    |
|                      | Centralized Banking   | Global Consensus Code  |
+----------------------+-----------------------+------------------------+
Trillion-dollar asset managers look at this systemic reality and understand that holding cash or sovereign debt is guaranteed long-term wealth destruction. To preserve their power and protect their capital from inflation, they require an asset that cannot be manipulated, diluted, or printed by any centralized government.
They found that exact solution in Bitcoin — The World's First True Digital Gold.
The Absolute Scarcity Paradigm (The Ultimate Note)
Let us revisit the final, crucial .
Note :-from our village storefront analogy to understand why Bitcoin reigns supreme over every asset class in human history.
In our village market, if the price of sugar spikes to extreme highs due to a supply deficit, the underlying physical system can adapt. Agricultural farms can plant more sugarcane, factories can scale production lines, and suppliers can flood the market with thousands of fresh sugar packets to cash in on high prices. The supply of sugar is elastic; it can always expand to meet demand.
But Bitcoin completely breaks this traditional rule. Bitcoin possesses Absolute, Mathematical Scarcity.
The open-source code of the decentralized blockchain ledger contains an immutable, unchangeable architectural rule: There will only ever be exactly 21,000,000 (21 Million) Bitcoins in existence.
No matter how high global demand surges, no matter how many trillions of institutional dollars BlackRock injects into the system through their Spot ETF (like IBIT), and no matter how much computing power bitcoin miners deploy, it is physically and mathematically impossible to ever create a 21,000,001st Bitcoin.
Furthermore, through a programmatic mechanism known as the Bitcoin Halving, the issuance rate of new Bitcoins is cut exactly in half every four years.
- Global adoption and demand are expanding geometrically.
- New incoming daily supply is cut in half every four years.
- Whales are aggressively buying up the existing circulating supply and locking it permanently away into offline, cryptographic Cold Wallets (কোল্ড ওয়ালেট, removing it from exchange counters.
When you take an asset with a permanently shrinking supply and put it against an exploding global demand driven by a collapsing fiat money system, the macroeconomic conclusion is undeniable. The short-term price drops we see on daily charts are nothing more than a temporary distraction. The macro-structure of Bitcoin is mathematically engineered to appreciate over long horizons.
Conclusion: The Final Choice
The financial markets are not a playground of random luck; they are a highly sophisticated transfer engine designed to move wealth from the impatient, uneducated crowd to the patient, disciplined elite.
Every time a retail trader panics and sells their holdings during an RSI oversold flush, they lock in a loss and directly hand their cheap coins over to a global institution. The temporary price crashes we witness are not signs of failure; they are simply the mechanical engine of The Whales' Trap resetting itself, cleansing the market of over-leveraged speculators, and initiating a massive long-term hand-over of digital real estate.
In this rapidly shifting digital era, traditional paper money is turning into an endless supply of cheap sugar packets. Meanwhile, Bitcoin stands firm as a decentralized monument of absolute mathematical truth. The choice for the modern investor is simple: continue holding an inflationary asset designed to decay, or align your wealth with the immutable laws of demand, supply, and the permanent scarcity of digital gold.