Understanding the Crypto Options Data Page on Binance

Understanding the Crypto Options Data Page on Binance
2023-10-19
Disclaimer: Digital asset prices can be volatile. Do your own research. Not investment advice. See full terms here and our risk warning here and below. Binance Futures products are restricted in certain countries and to certain users. This communication is not intended for users/countries to which restrictions apply.
Main Takeaways
- The crypto options data page on Binance offers a summary or generalized review of the different metrics to analyze the options market.
- The insights from this data provide a snapshot of market sentiment, liquidity, and potential price movements.
- The information available on this page serves as a compass, guiding traders to make informed choices and optimize their strategies.

Binance Options provides a platform for traders to hedge against potential price fluctuations, speculate on future price movements, and employ advanced trading strategies within a secure and user-friendly environment.
What is the Crypto Options Data Page on Binance?
To empower traders with data-driven decisions, Binance Options also offers real-time insights and actionable metrics on crypto markets.
The crypto options data page on Binance offers a comprehensive overview of options data. It incorporates crucial metrics to provide a snapshot of market sentiment, liquidity, and potential price movements. The insights from this data can give traders an edge in their decision-making processes.
The information available on this page serves as a compass, guiding traders to make informed choices, optimize their strategies, and navigate potential pitfalls. This article looks at the different metrics available on this page. It also dives into the insights traders can decipher about the market from this information.
Overview
The Binance Options Data page offers a summary or generalized review of the different metrics to analyze the options market. It includes various symbols and analysis of the following.
Top 5 Open Interest
Open interest refers to the total number of outstanding Options that have not been settled. It represents the total number of contracts that are actively held by market participants and neither have been exercised, closed, nor expired.The top 5 open interest metric displays the highest-performing options in a particular cryptocurrency market. Traders can use the Binance Options Data page metric to filter the top open interest by notional value or the number of contracts, where the notional value denotes the value of the underlying asset.
Top 5 24-hour Volume
This metric displays the number of options traded in a particular cryptocurrency market. It considers the highest trading volume of the underlying crypto asset in the past 24 hours. It can also be filtered by notional and contract.
Open Interest: Call vs. Put and 24-hour Volume: Call vs. Put
The call and put options are calculated as percentages in terms of open interest and 24-hour trading volume of the underlying asset. For instance, suppose the cumulative value of outstanding call options of a particular cryptocurrency is ~186,363,530 USDT, and its put options are ~140,354,436 USDT. Specific to this case, calls represent 57.04% of the open interest, while puts represent 42.96%.
This indicator helps traders to gain insight into investor sentiments and adjust their trading strategies.

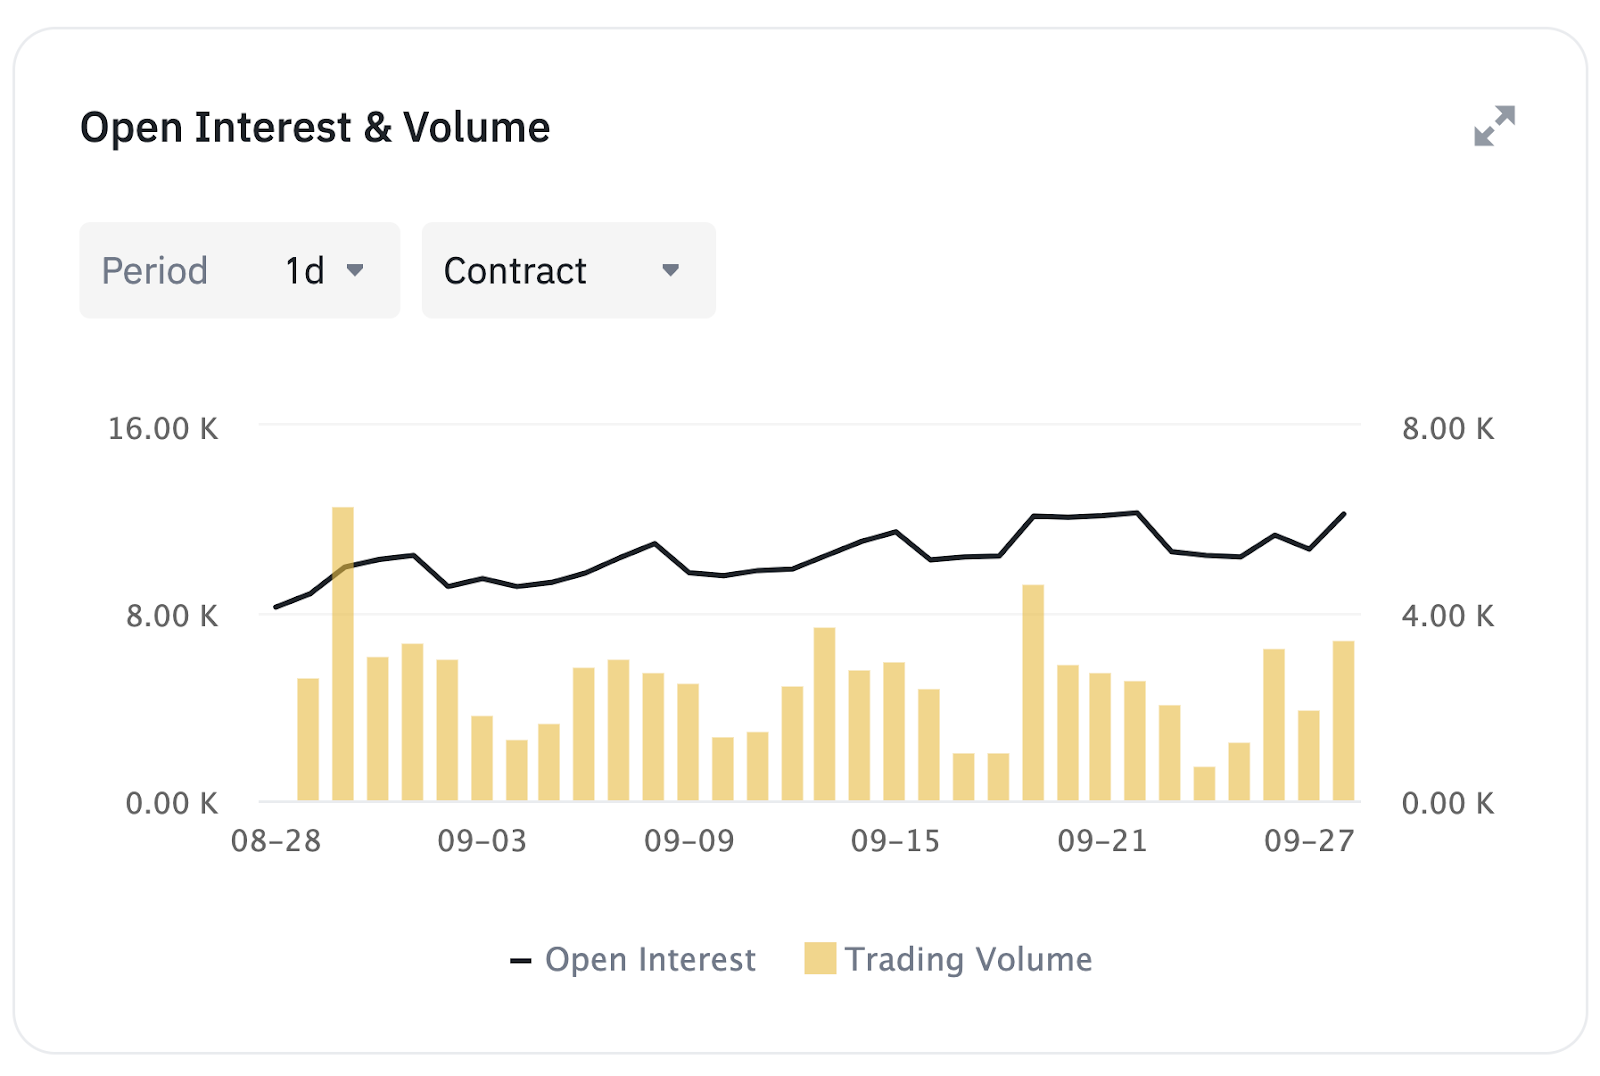
Open Interest & Volume
A bar and line graph summarize the open interest and volume of the underlying asset. The line represents the open interest, while the bar denotes the trading volume within a certain timeframe. The metric uses 1d, 12h, 6h, 4h, 2h, and 1h timeframes for the analysis. Traders use it as a technical indicator to determine the liquidity of a contract and make informed trading decisions.
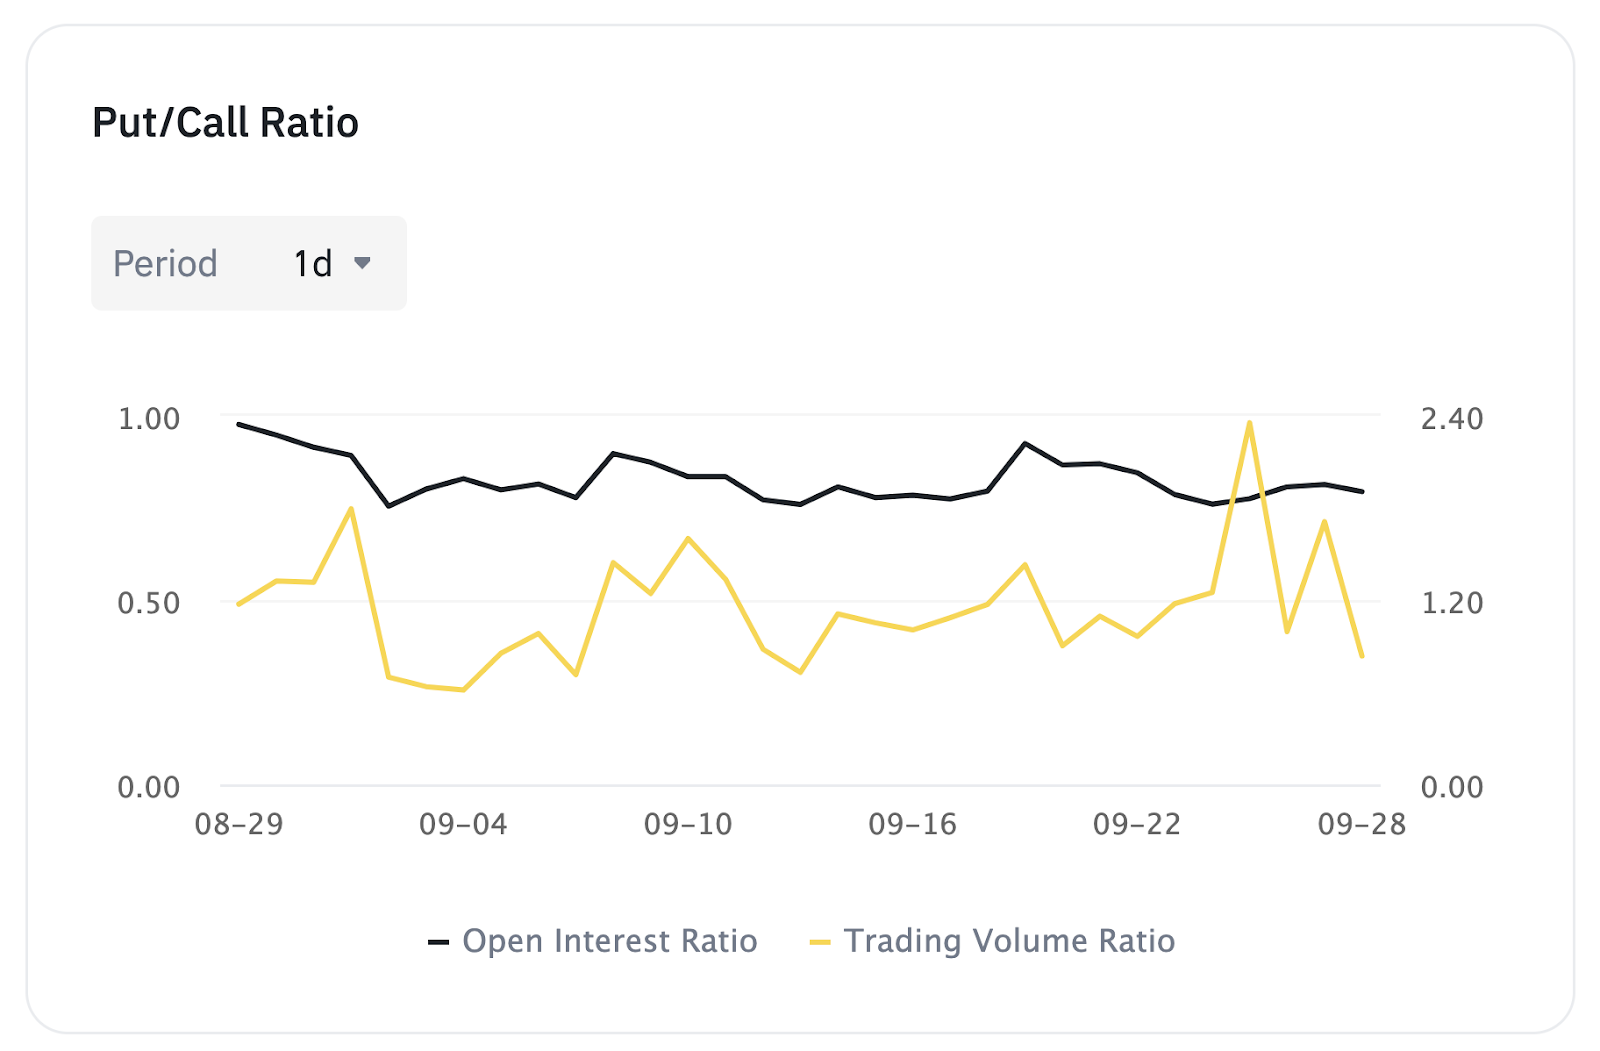
Put/Call Ratio
A put/call ratio (PCR) is a technical analysis tool used to gauge the overall investor sentiment on the market. The Binance page displays it as a double-line graph, where one line represents the open interest ratio and the other the trading volume ratio of puts and calls. It is calculated by dividing the total put Open Interest by the total call open interest. It is also the quotient of traded put volume over traded call volume.
Traders use the put/call ratio indicator to determine excessive market movement. A PCR above 0.7 implies investors are purchasing more puts than calls, signaling a potential bearish sentiment.
Open Interest & 24hr Volume
The open interest and 24-hour volume are visually represented in a bar and line graph and grouped by:
- Strike price: filtered by type (call, put, or both), expiry (specific or all), and contract and notional.
- Expiration: also filtered by type (call, put, or both) and expiry (specific or all).

24-hour Taker Flow
The 24-hour taker flow shows the call and put options traded by contract and premium. It is represented in shades of green and red in a doughnut chart. For instance, light red (puts bought), dark red (puts sold), light green (calls bought), and dark green (calls sold). Each data series adds up to 100% of the chart.

Implied Volatility
Implied Volatility (IV) is a fundamental concept in the world of options trading, representing the market's expectation of how much an asset's price will move in the future.
It is derived from an option's market price and indicates the annualized expected one standard deviation range of the asset's price over the life of the option.
- The IV skew, commonly known as the volatility skew, captures the disparity in implied volatility between out-of-the-money Call and Put Options.
- This skew can arise due to various market factors such as supply and demand imbalances, market sentiment, or specific event risks.
- On Binance, the Options mark price IV skew data reflects the divergence in IV across different strike prices for a given expiration, providing traders with richer insights into market perceptions and potential price movements.
Open Interest and Volume
Open interest and volume metrics are essential in defining the liquidity of an options contract. In option trading, traders define open interest as the number of active or outstanding options that remain unsettled. Volume indicates the number of options traders have traded within a specific timeframe.
It is visualized on the Binance Options Data page as bar graphs of calls and puts, where puts are displayed in red and calls in green. Open interest and 24-hour volume are categorized by strike price, expiration date, and history. Open interest and volume can give investors insight into a certain option’s price movement, liquidity, and demand when used together.

Max Pain
Max pain in options trading refers to the strike price at which most options contracts would expire worthless or with minimal value, resulting in maximum financial losses to option holders. The max pain price, in some cases, is equivalent to the asset’s strike price.
The max pain indicator may signal where traders have vested their interests in impacting the asset’s price to benefit their options positions. For instance, the max pain indicates the potential price level wherein options sellers attempt to drive the price of the underlying cryptocurrency asset at expiration to maximize their gains or minimize those of options buyers. However, the max pain price may adjust along with the crypto market conditions.

Max pain is calculated by summing the intrinsic values (the measure of worth) of all outstanding calls and puts and comparing them to every probable strike price at expiration. The max pain is the point at which the combined intrinsic value of all put and call options is the lowest. The calculation is as follows:
Call Intrinsic Value = (Index Price - Strike Price) * Open Interest
Put Intrinsic Value = (Strike Price - Index Price) * Open Interest
For more insights into the Max Pain Price, visit the dedicated FAQ.
Intrinsic Value: difference between the current price of the underlying asset and the strike price of the option.
Strike Price: the predetermined price at which an options contract can be exercised, allowing the holder to buy (for call options) or sell (for put options) the underlying asset.
Index Price: The Binance Options Spot Price Index is the same as the price index used for USDⓈ-Margined Perpetual Futures contracts. The Spot Price Index used for Binance Options contracts can be regarded as a Fair Spot Price.


