How to Perform Stock Market Technical Analysis?

How to do technical analysis? How should you trade based on which indicators? Chart formations and more...
PRICE
Price is the exchange rate of a good. This ratio is a result that is affected by the reaction of many variables that can or cannot be calculated. Trying to understand whether the price formed in organized secondary markets is actually correct is a concept that technical analysis rejects.
There are two traditional approaches to forecasting stock prices.
Fixed Base Theory (Firm foundation theory)
Price is a real value determined by a comprehensive analysis of future expectations. In this case, the difference between this determined price and the market price is used for trading. John B. Williams proposed finding the real value of the stock by discounting method, basing this theory on dividend income.
Castles in the Sky Theory
According to John Maynard Keynes; Instead of spending their energy on calculating real values by building models, professional investors should focus on how the investor community will behave in the future and how, in optimistic times, they will turn their hopes to building castles in the sky. Keynes compares playing the stock market to a beauty pageant organized by a newspaper. In this competition, the grand prize will be given to the person who guesses the six most beautiful faces as a group, out of a hundred candidates. The selection method here should be based on what the majority will choose, not on personal preference.
Greater Fool Theory:
Everyone buys a stock to sell it to someone else at a higher price. Prices will rise as long as there are people who are willing to pay higher prices just because of mass psychology, even when there is no real reason to do so. In such a world, it is always possible to find someone more stupid, and it is a good approach to pay twice as much now for a bill that may later find a buyer for five times its real value. Despite all this, it was determined that stock prices were not completely random and Efficient Market Theory was developed by Eugene Fama. If a market is fully efficient, all information is reflected in the price and it is not possible to make a profit by trading in such a market.
Individuals behave differently when they act independently within a community. While individual behavior cannot be predicted easily, group behavior is more easily predicted. In his book The Crowd (1895), Gustav Le Bon says that what accumulates in communities is not natural understanding but stupidity. Communities can be found in companies, football teams, armies, and financial markets.
Man's need to comply with universal rules and participate in larger wholes is an important key to understanding social economic and political activities.
As a result, major movements in the market are the result of the majority of investors not being able to fully predict major developments in the market.
The rule for successful investing is to closely watch what other investors do and say and do the opposite of what they do. This rule, which keeps the successful investor away from community pressure, is a rational approach to an irrational environment.
GRAPHIC TYPES
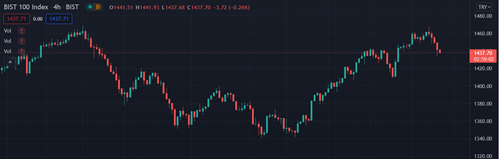
CANDLESTICK CHART
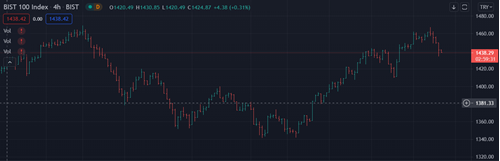
BAR CHART
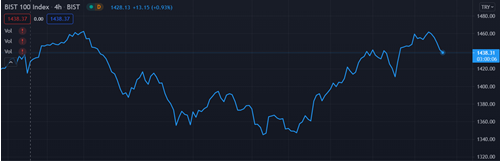
LINE CHART
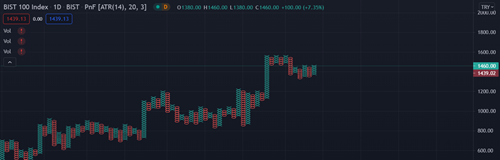
ZERO TIMES (POINT&FIGURE) CHART
BREAK
Breaking the small support (resistance) gives the first signals of the change of the medium and the breaking of the medium support gives the first signals of the change of the major trend.
CHART FORMATIONS
REVERSAL PATTERN
Shoulder Head Shoulder
Double Bottom and Top
Diamond (Diamond)
SHOULDER HEAD FORMATIONS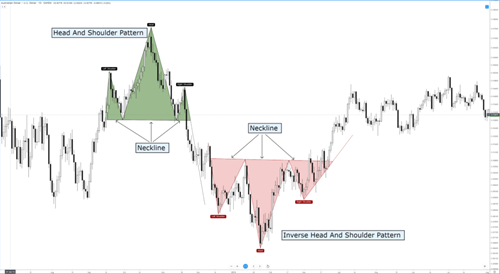
Straight
They are trend transformation formations. During reversals from the peak, the trading volume is highest in the head area on the left shoulder. The price level is higher than the left shoulder, but the volume is the same or lower.
The volume on the right shoulder is definitely lower than the left shoulder. The price level is at or below the level of the left shoulder.
Prices are moving lower than the neckline. The breakdown has begun.
If the price movement and measurement formula after the break turns into a market trend that completes the head and shoulders, prices will suddenly start to fall with high volume after the neckline is broken. After the neck line is broken, unless there is a significant increase in transaction volume, prices will not fall immediately and rapidly. Prices turn up after falling slightly below the neckline (pull back). After this last gasp, prices drop sharply and volume increases. How much will prices drop after the head and shoulders are completed? The distance from the top of the head to the neckline is measured. Once the right shoulder is completed, the minimum downside target is equal distance after prices break the neckline.
Opposite
The main distinction between an inverted head and shoulders pattern and a straight one occurs in trading volume.
Multiple Head Shoulders
Usually consist of two left shoulders, one head, and two right shoulders of approximately equal size. It is found in examples where the number of shoulders is more than two.
TRIANGLES (TRIANGLES)
Triangle formations are seen as both transformation and consolidation formations.
Symmetrical triangle
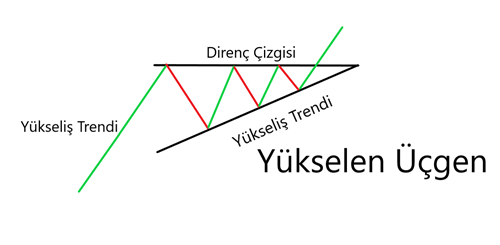
Ascending triangle
Descending triangle
TRIANGLE FORMATIONS


In rectangles, as in symmetrical triangles, it is not known in advance in which direction the prices will break. However, the odds are that the rectangle will develop as a consolidation formation, thus continuing the previous trend rather than breaking it. The symmetrical triangle is the "picture of doubt" and the rectangle is the "picture of conflict".
KEY TRENDS
bull market
Stage 1: Accumulation period, in which smart investors, sensing that the stagnant market is starting to change, collect stocks that have been sold well below their value by discouraged and distressed investors. At this stage, the financial statements and reports of the companies are still bad and there is no interest from the public.
Phase 2: The phase in which economic trends begin to improve and transactions increase. This is the period when the technical analyst can earn the most.
Stage 3: The people attacked and the volume exploded. At the end of this stage, trading volume continues to increase, but low-priced stocks that do not have investment value begin to decline rapidly.
Bear market
phase 1: It is the distribution phase that coincides with the last period of the bull market.
Stage 2: It is the panic stage, buyers decrease and sellers act hastily. While transaction volume increases at a high rate, the downward trend of prices becomes almost vertical. After the panic phase, there is a second revival period or horizontal market for a long time.
Stage 3: At this stage, purchases have started, albeit slightly. It ends when all the bad news is gone.
SECONDARY TRENDS
These are reaction trends that stop the main trends. They form between three weeks and a few months. They usually retrace one-third to two-thirds of the previously recorded rise or fall in the underlying trend.
SMALL TRENDS
These are deceptively small and very short-term fluctuations.