Subscription or One-Time Purchase? How to Actually Compare Trading Indicator Costs
Premium charting indicators are sold two ways: a recurring monthly fee, or a single upfront payment. On the surface this looks like a simple math problem — add up twelve months of a subscription and compare it to the one-time price. In practice, most traders get the comparison wrong, because the real cost isn't just the sticker price, and the real value isn't just the feature list on the pricing page.
The Obvious Math, and Why It's Incomplete
Start with the part that's easy to get right. If a subscription costs $50 a month, a year of it costs $600. If the one-time alternative costs $150, the arithmetic says the one-time option wins after month three. That part isn't in dispute.
What the simple math misses is what happens on both sides of that line over a longer horizon. A subscription tool keeps charging every month for as long as you use it — year two costs the same as year one, with no discount for loyalty. A one-time tool charges once and then, depending on the vendor's terms, may or may not include future updates. Read the fine print on both: "lifetime access" sometimes means the current version only, with major rewrites sold separately later as a new product.
Hidden Variables the Headline Price Doesn't Show
Beyond the raw dollar figure, a handful of variables routinely get left out of the comparison entirely. Does the price include access across multiple devices, or is it a single-seat license? Does it include access to every asset class the tool supports, or are certain markets gated behind a higher tier? Is customer support included at the base price, or sold separately? Is there a data feed or exchange fee bundled in, or is that an extra cost on top? None of these show up in a simple "monthly vs one-time" headline comparison, but they can shift the real landed cost by a meaningful margin in either direction.
Three Questions That Matter More Than the Price Tag
1. What happens if you stop paying? A subscription tool typically disappears from your chart the moment the subscription lapses, including any custom alerts or saved settings built around it. A one-time purchase usually keeps working indefinitely, even if you never buy another update. If you expect to pause trading for a few months — a common pattern around life events, tax season, or simply burnout — this difference compounds fast.
2. Does the price reflect ongoing support, or a one-time workload? Some subscription pricing genuinely buys ongoing work: new features, broker integrations, responsive support tickets, community access. That's a fair trade if you'll actually use those things. Other subscriptions are really a one-time script wrapped in a recurring billing plan because recurring revenue is more attractive to sell than it is useful to you. Ask what changes between version 1.0 and version 2.0, and how often that update has actually shipped in the past year — not just what's promised on the roadmap page.
3. What's your actual holding period? A trader testing a new signal approach for a month or two is better served by the lowest-commitment option available, even if it's nominally the more expensive per-month choice. A trader who has already validated an approach and plans to run it for years benefits more from paying once and being done with the decision.
A Fourth Question Worth Adding: Who Owns the Switching Cost?
Every indicator you build habits and alert rules around creates a small switching cost if you ever want to move to a different tool. Subscription tools, because they can vanish the day you stop paying, implicitly force you to re-evaluate that switching cost every renewal period — which some traders find useful discipline, and others find an annoying tax on inertia. A one-time tool removes that recurring decision point, for better or worse: you're less likely to be forced to reconsider whether the tool is still serving you, which can mean comfortable continuity or just as easily mean sticking with a mediocre tool out of habit.
The Trap of Comparing List Price Only
Vendors in this space often publish a list price and a "launch" or "founder" discount that effectively becomes the real price everyone pays. If you're comparing two tools by their advertised monthly rate, check whether either one is currently running a long-term promotional rate that resets after a trial period. The comparison that matters is landed cost over your actual expected usage window, not the number on the pricing page on day one.
It's also worth checking whether a one-time tool bundles things a subscription tool sells as add-ons — alert templates, strategy presets, multiple asset-class variants — or vice versa. Two tools that look similarly priced on the surface can differ meaningfully once you account for what's actually included.
Watch for Tiered "Founder Pricing" That Isn't What It Claims
A specific pattern worth naming: some vendors sell early access at a discounted "founder" rate with language suggesting the price will rise substantially later, creating urgency to buy now. Sometimes that's genuine — the product is new and pricing will indeed rise once a feature set is complete. Other times, the "founder" price has quietly remained the standing price for years, with the urgency language left in place purely as a conversion tactic. Before treating a discount deadline as real, it's reasonable to simply wait a week and see if the price actually changes. If it doesn't, you've learned something useful about how that vendor prices, at no cost to you.
Smart Money Concepts Tools: A Case Study in the Subscription-vs-One-Time Debate
One specific category where this debate shows up constantly is Smart Money Concepts (SMC) indicator suites — tools that attempt to visualize order blocks, liquidity sweeps, fair value gaps, and similar institutional-flow concepts on a retail chart. This category has historically been dominated by subscription-based suites, in part because the visual complexity of these tools (dozens of configurable zone types, multi-timeframe overlays) creates genuine ongoing maintenance work as charting platforms update their scripting languages.
More recently, one-time-payment alternatives covering the same SMC concept set have entered the market, generally positioning themselves as a lower lifetime cost for traders who don't need frequent feature additions. The technical quality gap between subscription and one-time SMC tools has narrowed considerably — the real differentiator in most comparisons comes down to update cadence, support responsiveness, and whether the specific zone-detection logic matches how you personally interpret order flow, rather than any inherent superiority of one payment structure over the other.
What to Actually Test Before Choosing Between Two SMC-Style Tools
Rather than deciding based on payment structure alone, it's worth running both candidate tools side by side on the same chart for a week or two before committing financially to either. Specifically check: do the two tools agree on where major order blocks and liquidity zones sit, or do they diverge meaningfully? Does one update its zones more aggressively as new price data comes in, in a way that might qualify as a form of repainting the zone's boundaries after the fact? Is the visual density manageable on your actual screen size and the timeframes you trade, or does one tool clutter the chart past the point of usefulness? These functional questions matter more to daily usability than the subscription-versus-one-time framing that dominates most comparison articles.
Common Mistakes Traders Make When Comparing Payment Structures
Mistake: Anchoring on the First Price You See
Whichever pricing page you land on first tends to become the mental baseline against which every other option gets judged, even if that first page wasn't representative of the category. If you're seriously evaluating indicator spend, it's worth looking at four or five comparable tools before forming an opinion about what a "normal" price looks like for the feature set you need. Anchoring on one vendor's number — especially if it was the first or most heavily marketed one you encountered — skews the entire comparison.
Mistake: Confusing Annual Discount With Total Savings
Many subscription vendors offer a discounted annual plan ("save 20% when billed yearly") that looks like pure savings. It is savings relative to paying monthly for the same vendor, but it's not necessarily cheaper than a competing one-time tool, and committing to a full year upfront removes the flexibility of cancelling after a bad month. Treat the annual discount as a separate decision from the subscription-versus-one-time decision, not as proof that subscription pricing has "won" the comparison.
Mistake: Ignoring Currency and Payment Processing Costs
For traders paying in a currency different from the vendor's listed price, currency conversion fees and payment processor markups can add a few percent on every transaction. This matters more for recurring monthly charges, where the fee is paid every single month, than for a one-time purchase, where it's paid exactly once. It's a small factor individually, but worth factoring into a multi-year total cost comparison.
Mistake: Not Checking Refund and Cancellation Terms Before Buying
Before any purchase, check how cancellation actually works in practice — is it instant through a self-service portal, or does it require emailing support and waiting days for confirmation while charges continue to accrue? Some subscription vendors make sign-up frictionless and cancellation deliberately slower. This isn't always visible on the pricing page itself and often requires checking the vendor's terms of service or searching for independent user reports before committing a card number.
How to Build Your Own Cost Model Instead of Trusting a Vendor's Comparison Chart
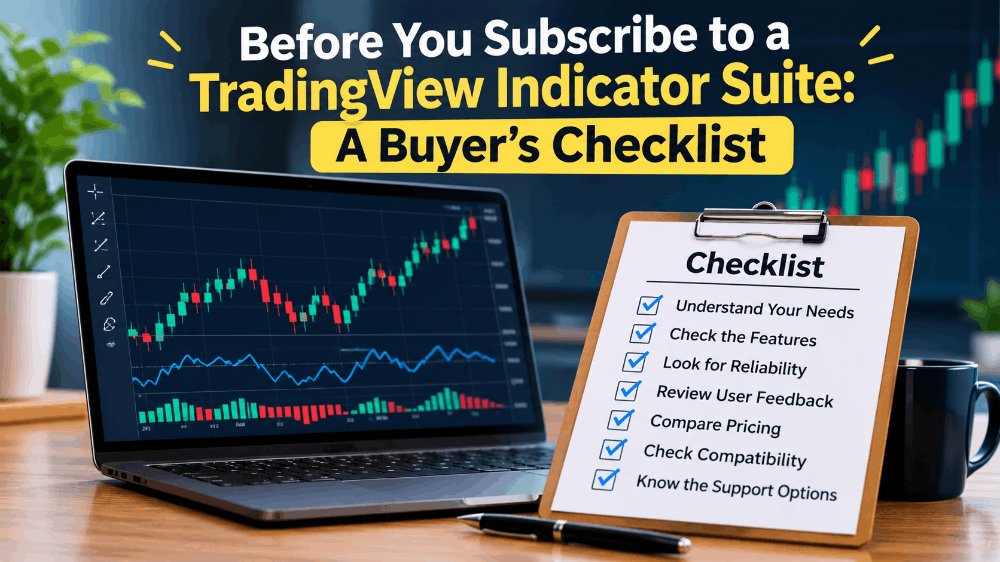
Vendor-published comparison charts, including ones that favorably compare their own one-time price against a competitor's subscription, are marketing material first and analysis second. A more reliable approach is building a simple personal model: list your realistic usage horizon in months, the monthly cost of every subscription candidate, the one-time cost of every one-time candidate including any known update fee, and any of the hidden variables covered above — multi-device access, asset gating, support tier, bundled data.
Once laid out side by side in even a basic spreadsheet, the actual landed cost over your specific horizon becomes obvious without needing to trust anyone's marketing framing. This also has the side benefit of making it easy to re-run the comparison later if your usage horizon changes — for example, if you originally planned to trade for a year and find yourself still active after three.
A Worked Example of the Model in Practice
Consider a trader comparing a subscription-based SMC suite at $40/month against a one-time SMC alternative at $249 with a stated $49 fee for "major version" upgrades, historically released roughly once every eighteen months. Over a two-year horizon, the subscription totals $960. The one-time tool totals $249 plus, roughly, one major upgrade fee of $49, for $298 — assuming the trader chooses to pay for the upgrade at all, which isn't mandatory if the current version still functions. Over a three-month horizon instead, the subscription totals $120 against the one-time tool's full $249, reversing which option is cheaper. The crossover point in this example sits a little past six months — below that, the subscription wins; above it, the one-time tool wins. Running this kind of simple arithmetic against your own realistic horizon, rather than against someone else's marketing comparison, is the only way to get an answer that actually applies to your situation.
A Simple Framework
- Write down your realistic time horizon for using this category of tool — three months, one year, multiple years.
- Multiply the subscription's monthly cost by that horizon. Compare it honestly to the one-time price, including any renewal or update fee the one-time option might carry.
- Check what happens to your access, alerts, and saved configurations if you cancel or stop paying either option.
- Weigh whether you actually need ongoing updates and support, or whether a stable, mature tool that rarely changes suits you better.
- Price out the real cost including any promotional period ending, not just the headline number shown today.
- Run a side-by-side trial of both candidates for at least a week or two before paying for either, if the vendor allows it.
- Account for hidden extras — multi-device access, asset-class gating, support tiers, bundled data feeds.
Evaluating Non-Price Factors That Often Decide the Comparison in Practice
Price, once modeled properly, often turns out to be close enough between serious competing options that the decision actually comes down to softer factors that rarely get top billing in a comparison article.
Documentation Quality
A tool with clear, specific documentation — what each setting controls, what each visual element represents, suggested starting configurations for different trading styles — saves hours of trial and error regardless of price. A tool with vague or marketing-heavy documentation ("our proprietary algorithm adapts to market conditions") often means more time spent guessing at settings, which is a real cost even if it never appears on an invoice.
Community and Peer Feedback Quality
Subscription tools often bundle access to a private community (Discord, forum, or similar) as part of the pricing. Whether that's worth paying for depends entirely on whether the community is actually active and substantive, or mostly automated engagement and repeated promotional posts. It's reasonable to ask a vendor for a preview or trial of the community space before paying specifically for that access.
Platform and Script Limit Compatibility
Charting platforms impose their own technical limits — a cap on how many plots or drawing objects a single script can render, for instance. A feature-dense indicator suite can sometimes hit these platform-level limits, causing visual glitches or missing elements that have nothing to do with the vendor's code quality. Checking for recent user reports of this kind of platform-level conflict, separate from the vendor's own claims, is worth the extra few minutes before paying for a visually complex tool.
Frequently Asked Questions
Is a one-time payment always cheaper in the long run?
Not always — it depends on your actual usage horizon and whether the one-time tool charges separately for major future updates. For a trader who sticks with one tool for years, one-time pricing usually wins. For a trader who cycles through tools every few months while refining their approach, a low-commitment subscription can actually cost less overall.
Should I trust a vendor's advertised "limited time" discount?
Treat it skeptically until you've watched whether the price actually changes after the stated deadline. Some discounts are genuine; others are a permanent fixture of the pricing page dressed up as urgency.
Does a higher price mean a better signal?
No. Price reflects a mix of development cost, marketing spend, community size, and perceived positioning — not a direct measure of signal quality. The only way to judge signal quality is to test the tool directly on your own charts and instruments.
What should I check before switching from one paid tool to another?
Run both tools in parallel for a period before cancelling the old one, so you're not left without a working setup mid-transition. Also confirm whether any alerts, saved layouts, or strategy presets built around the old tool will need to be manually rebuilt on the new one.
Is it worth paying for a bundle of several indicators from one vendor instead of buying tools individually?
Sometimes, but only if you'll genuinely use most of what's bundled. Vendors often price a bundle so it looks like a steep discount compared to buying everything separately, but if you'd only ever have used two of the five bundled tools, the standalone price of just those two is the real comparison point — not the bundle's advertised "total value" figure, which assumes full usage of every component.
How often should I re-evaluate whether I'm still getting value from a subscription I'm paying for?
A reasonable habit is to check in at every renewal point and honestly ask whether you referenced the tool meaningfully in the period just completed. A tool that sits unused on a chart for months while still being billed monthly is an easy, low-effort saving to capture simply by cancelling and re-subscribing later if you end up needing it again.
This framework applies whether you're comparing two subscription tools, two one-time tools, or one of each — the category that sparked the most reader questions recently has been subscription-based Smart Money Concepts suites against newer one-time-payment alternatives. For a detailed side-by-side on pricing structure and signal architecture in that specific comparison, this breakdown comparing a well-known subscription suite against a one-time-payment alternative walks through the numbers and the technical differences in full.
Whichever structure you land on, the right call isn't "subscription is bad" or "one-time is always cheaper." It's matching the payment structure to how long you'll actually use the tool, testing both candidates functionally before paying either, and reading the fine print on what each structure does and doesn't guarantee you.
The broader lesson extends past indicators specifically: any recurring software cost in a trading workflow — charting platform tiers, data feeds, scanning tools — benefits from the same discipline. Model the real cost over your actual horizon, check what happens on cancellation, and treat marketing urgency around pricing deadlines as a claim to verify rather than a fact to accept.
It's also worth revisiting this decision periodically rather than treating it as a one-time choice made at the moment of purchase. Trading needs change — a strategy that required daily multi-timeframe confluence checks a year ago may have evolved into something simpler, or the reverse. Building a habit of re-running this cost model once or twice a year, rather than only at the original purchase decision, keeps the payment structure matched to how you're actually trading now rather than how you were trading when you first signed up.