XRP/USDT – 15m timeframe
40
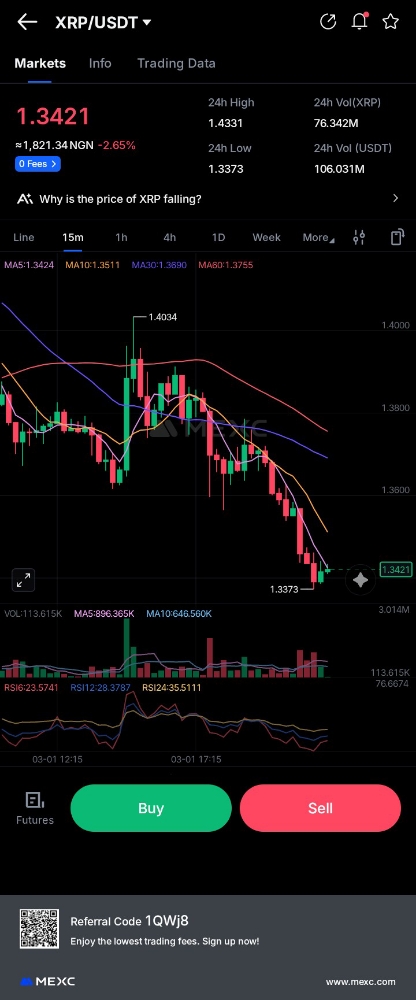
You’re now on XRP/USDT – 15m timeframe at $1.3421 (-2.65%).
This chart is very different from the SOL one you showed earlier.
📉 Market Structure
🔻 Short-Term Trend: Bearish
- Clear lower highs
- Clear lower lows
- Price dropped from $1.4034 → $1.3373
- Currently making a small bounce
This is a downtrend until structure changes.
📊 Moving Averages
- MA10 ≈ 1.3511
- MA30 ≈ 1.3690
- MA60 ≈ 1.3755
👉 Price is below all moving averages 👉 MAs are sloping downward
👉 Bearish alignment
That confirms short-term selling pressure.
🔥 RSI (Momentum)
- RSI around 23–35
- Entered oversold zone
What this means:
- Selling was aggressive
- A short bounce is possible
- But oversold does NOT mean reversal yet
In strong downtrends, RSI can stay oversold.
📦 Volume
- Big red volume candles during drop
- Buyers trying to step in near $1.3373
- Bounce volume still weak
Sellers currently stronger than buyers.
🧱 Key Levels
🔵 Support
- $1.3370 (just tested)
- If it breaks → $1.3200 next zone
🔴 Resistance
- $1.3550 (first minor resistance)
- $1.3700 strong resistance
- $1.400 psychological + previous high
📌 What Could Happen Next?
Scenario 1 (Most Likely Short-Term)
Small bounce to $1.35–$1.36
Then continuation downward if sellers defend.
Scenario 2 (Relief Rally)
If price breaks above $1.37 with volume
→ Move toward $1.40
Scenario 3 (Continuation Dump)
If $1.3370 breaks strongly
→ Quick move toward $1.32
🎯 Trading Perspective
Right now:
- This is not a strong long setup
- Catching falling knives is risky
Safer approach:
- Wait for structure break (higher high formation)
- Or wait for strong support confirmation
If you’re holding spot:
- This looks like short-term correction
- Need to check 1H / 4H to see bigger trend