Technical analysis in Crypto and Forex market.
1. The Core Philosophy of Technical Analysis
Technical analysis is built on three main pillars:
The market discounts everything: All known information—from inflation rates to Elon Musk’s latest tweet—is already reflected in the price.
Price moves in trends: Markets don't move randomly; they move in zig-zags called trends (Up, Down, or Sideways).
History repeats itself: Human psychology (fear and greed) is constant, meaning chart patterns that worked in 1920 often still work in 2026.
2. Essential Tools for Every Trader
To navigate these markets, you need a reliable "toolkit." Most pros stick to a combination of these three:
A. Candlestick Patterns
Candlesticks are the heartbeat of the chart. They tell you who won the battle between buyers and sellers over a specific timeframe.
The Hammer: A sign of a potential bullish reversal.
The Shooting Star: A sign that the bulls are exhausted and a drop is coming.
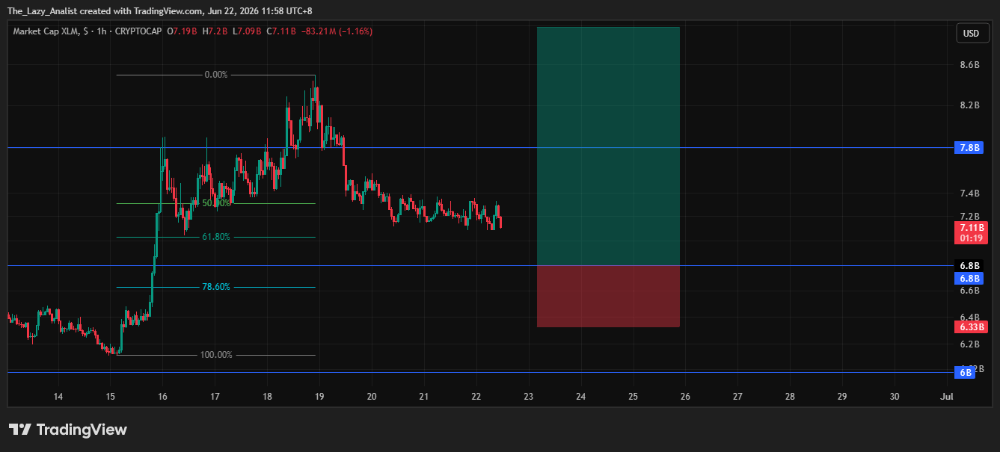
B. Support and Resistance
Think of Support as a floor that price bounces off of, and Resistance as a ceiling it struggles to break through. In 2026, many traders now use "Order Blocks"—zones where big institutions have placed massive buy or sell orders—to find these levels more accurately.
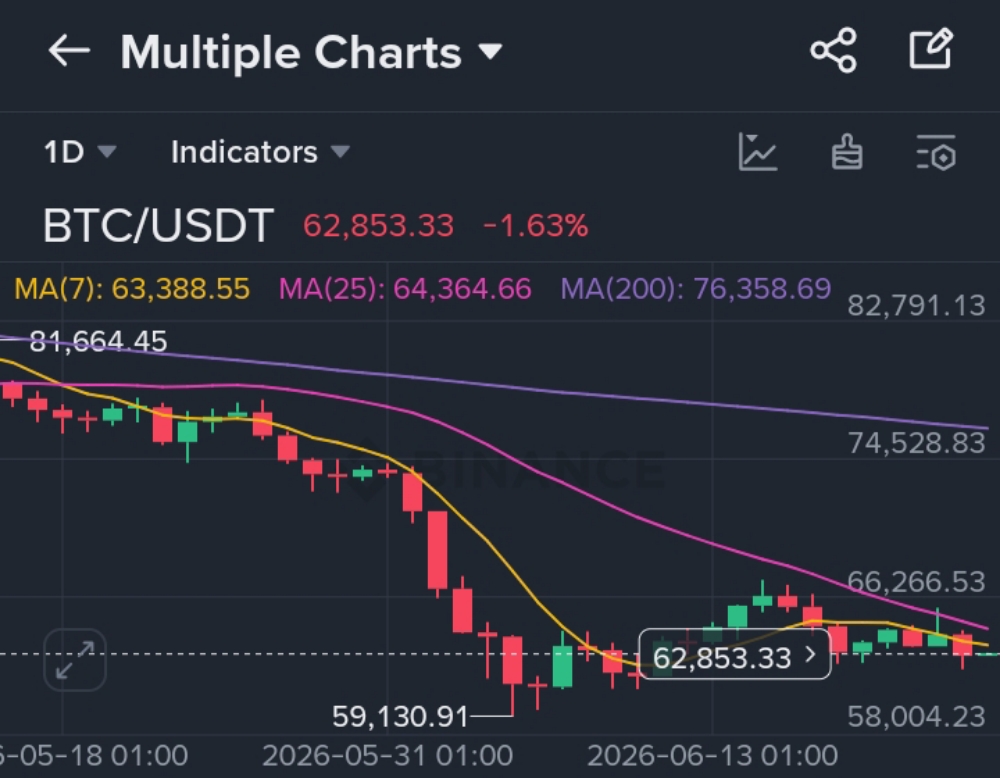
C. Technical Indicators
RSI (Relative Strength Index): Measures if an asset is "Overbought" (above 70) or "Oversold" (below 30).
Moving Averages (50 & 200 EMA): These act as dynamic support/resistance. If the price is above the 200 EMA, the long-term trend is your friend.
Volume: This is the "fuel." A price breakout without high volume is often a "fakeout."