Bitcoin – What I’m Seeing In The Charts

Boom!
The weekend kicked off with an extremely heavy blow for altcoins. Although Bitcoin only suffered a modest correction, altcoins got REKT. As addressed in previous articles, this is classic volatility for this particular period of the cycle. The months surrounding the halving are historically volatile and extremely unpredictable. However, when you compare what we have already experienced so far with previous cycles, we are getting off rather lightly… at least until now.
This does of course open up the possibility of a deeper correction. However, what we have experienced in the past 24 hours is still within the realm of my optimistic expectation. This was published on INLEO in a post published three days ago:
I expect BTC to chop around in here a little longer before breaking out. A breakout is more likely than a breakdown… but we will have to keep an eye on it in the meantime.
The screenshot below clearly depicts my expectations regarding Bitcoin’s price action. In a bullish scenario, price would retest the bottom of this ascending triangle pattern, and quite possibly more than once. The scenario I proposed was to “chop around” in this pattern before breaking out. However, as mentioned, a breakdown is also a possibility. What was however expected was a continuation within this pattern prior to a significant move.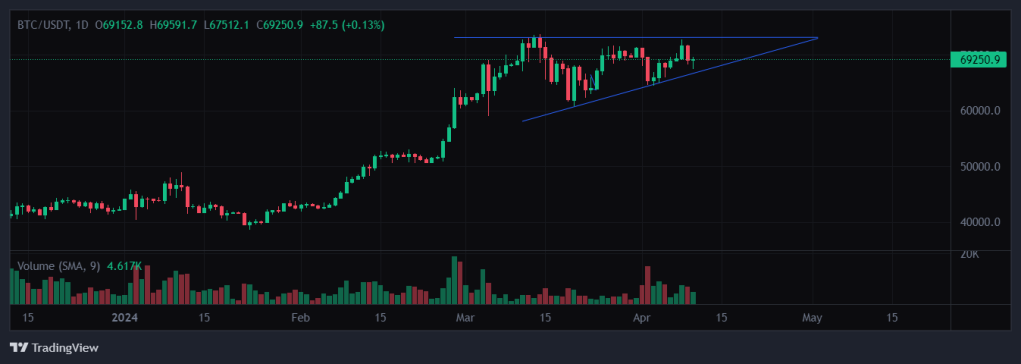
These particular patterns often see the price action extend deep within the structure, and so we are likely to see Bitcoin trade a few more days within the range of this pattern. The recent correction was caught by the support of this structure… by the skin of its teeth. A continuation of this pattern will result in the Bitcoin price moving back towards the top of the structure.
Unfortunately, if this structure fails, investors need to brace for a more significant correction. This would of course be more in line with previous cycles. However, Bitcoin ETFs have managed to produce a significant amount of price support, coupled with bullish sentiment. Will this however be enough to protect the market from a much deeper correction? A lot comes down to how well Bitcoin respects the abovementioned structure.
A healthy continuation of this pattern will see BTC moving back to the top of the range at approximately $69K to $71K. This would most likely be met by another modest correction back down to $67K/68K. There is however a rather concerning piece to this puzzle. BTC is barely hanging on to structural support. However when you zoom in on the hourly chart, BTC appears to have lost the support.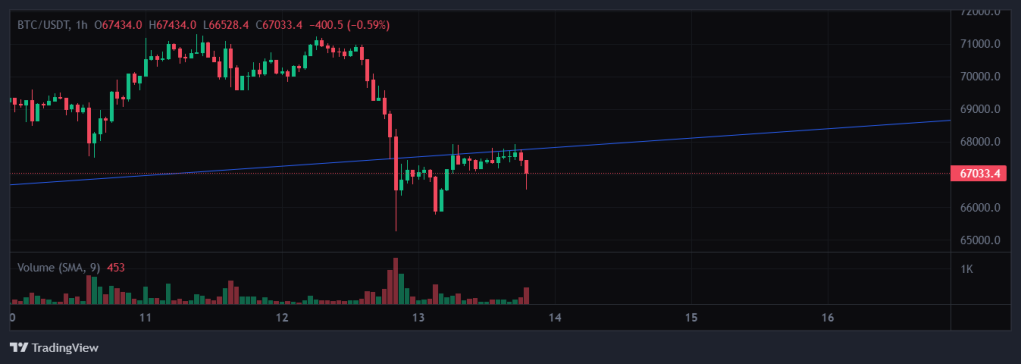
This is rather concerning, and could be an early indication of a deeper correction. Unless BTC experiences a significant green wick, it could just be the beginning of a much deeper correction. Traders will have to watch this structure very closely. It’s even possible that by the time I publish this article, Bitcoin has already made it’s move. Let’s hope we see some green, otherwise a continuation down is extremely likely. Catch you next time!
Disclaimer
First of all, I am not a financial advisor. All information provided on this website is strictly my own opinion and not financial advice. I do make use of affiliate links. Purchasing or interacting with any third-party company could result in me receiving a commission. In some instances, utilizing an affiliate link can also result in a bonus or discount.
This article was first published on Sapphire Crypto.

- Earn yield on your BTC, ETH & stablecoins - https://shorturl.at/uyLT0
- Tokenized real estate / $20 Voucher - https://shorturl.at/joEN5
- Purchase R500 Crypto = Free R200 BTC - https://shorturl.at/dmyC9
- Earn free ETH & OP reading & creating - https://shorturl.at/JPW58
- Earn HIVE & HE tokens reading/creating - https://shorturl.at/fBHPX
- Earn free SLCL (SPL) reading/creating - https://shorturl.at/quvP3
- Trade & buy altcoins & micro-caps - https://shorturl.at/atuMS
- Trade Crypto assets & futures - https://shorturl.at/uwSY3
- Earn passive income - https://shorturl.at/gxCIP
- Earn passive BTC - https://shorturl.at/fgEK2
- Free BTC every hour - https://shorturl.at/beinD
- Free BTC & DOGE - https://shorturl.at/dfiK1
- More passive BTC - https://shorturl.at/ahjI1
- Trade & buy altcoin gems - https://shorturl.at/yDENP