The Psychology of Support Broken: Why a BTC Drop is Actually a Hidden Bullish Signal

Assalamu Alaikum, brothers.
How is everyone doing? I hope everyone is doing well.
By looking at the title, you have surely understood what today’s discussion is about.
Those of us who are traders apply many different technical tools, create different strategies, and sometimes become successful and sometimes fail.
Now, have you ever thought about who is actually responsible for this game of success and failure?
Naturally, you may say it is because of applying technical tools incorrectly.
But nowadays, many people are using technical tools correctly and still are not making profit.
And one of the biggest reasons for not making profit is not being able to survive in the market.
Why are they unable to survive?
Because they have lost one of the main tools needed to survive—patience.
Now, you may ask why I said all of these things.
Because this is exactly what is happening now.
So, without making it longer, let’s move to the main discussion.
And you will understand in a moment why I said these things.
Current Chart Analysis
Today is 29 June, Monday.
Yesterday was 28 June, Sunday.
And exactly yesterday, meaning 28 June, Sunday, in the BTC/USDT pair on the spot market, a candle closed on the Weekly chart and today another weekly candle opened.
Now, you may say—what is new about that? This happens every week on the weekly chart.
Completely normal.
But brother, that is not the real point.
The real event is only about yesterday’s candle closing.
We know that when a candle starts, the price where it starts is the market open.
And the price where it closes is the market close.
Following that, if we look at yesterday’s candle, then we can see that the market opened at 62K from around 5 or 6 AM on 22 June (BD Time), and it closed yesterday, meaning at the end of 28 June or early morning of 29 June.
And it closed at 59K.
Another interesting thing is that there is a strong 200MA support at 62K.
What, surprised?
You should be.
Because even though a strong support level was formed at 62K, the market broke that support and closed at 59K.
So now a question may come to your mind—then the market should go lower.
This is where most people misunderstand things and get into trouble.
So, let’s correct the misunderstanding first.
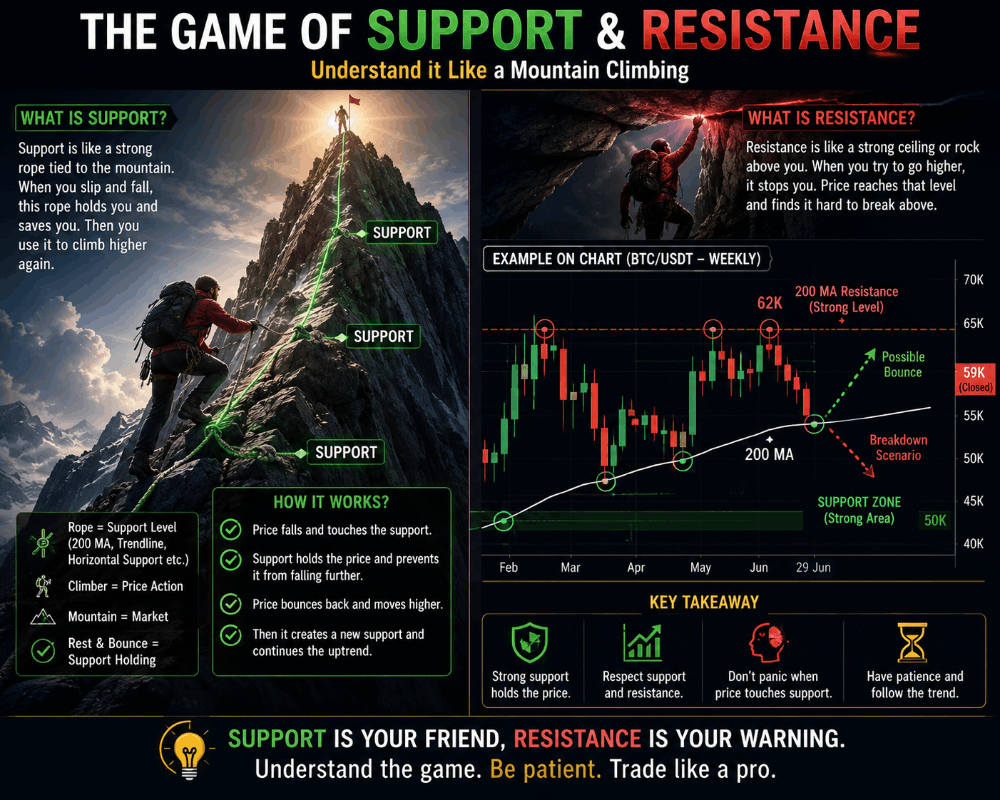
The Game of Support and Resistance:
Support and resistance are among the most popular concepts in chart analysis.
What is support? And what is resistance?
Suppose I am climbing a very high mountain.
Now, I cannot climb it just by saying I will, so I take a strong rope.
I throw the rope and securely tie it to a strong point on the mountain.
While climbing upward by holding the rope, I suddenly slip and start falling down. But by holding the rope tightly, I save myself and continue climbing higher.
This rope, and my story of going up and down, is basically like the condition of a market.
This rope is my support, through which I am able to climb upward.
In the same way, in the trading market, there are strong support levels such as the 200 MA and various other strong support levels from different tools.
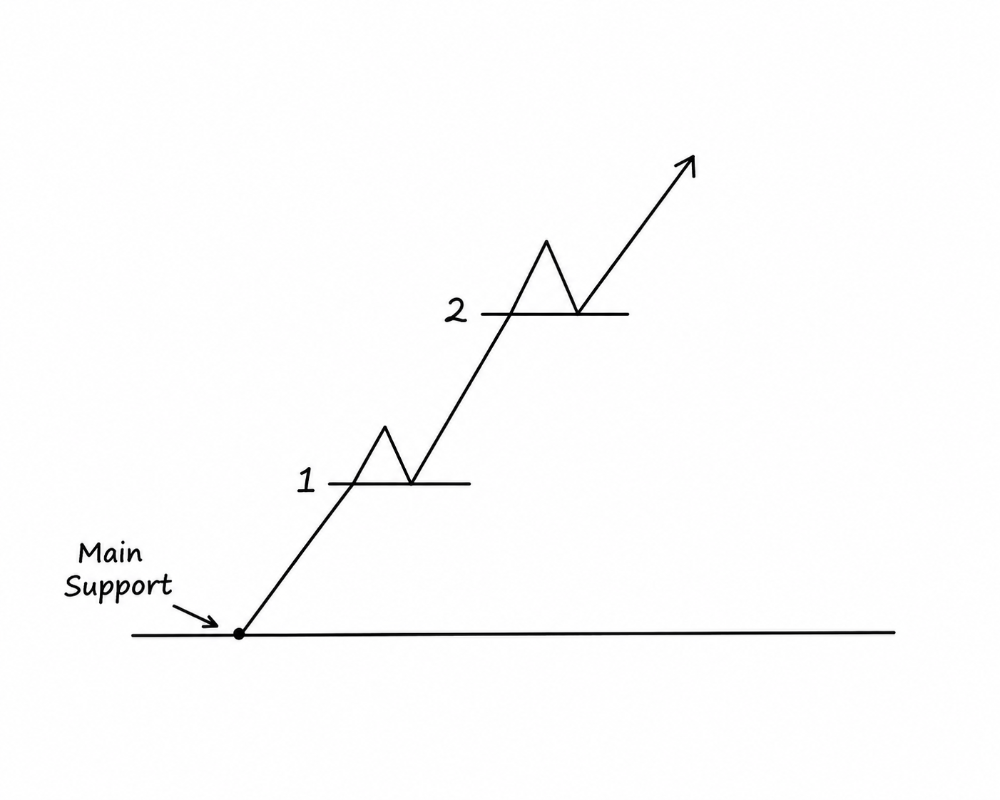
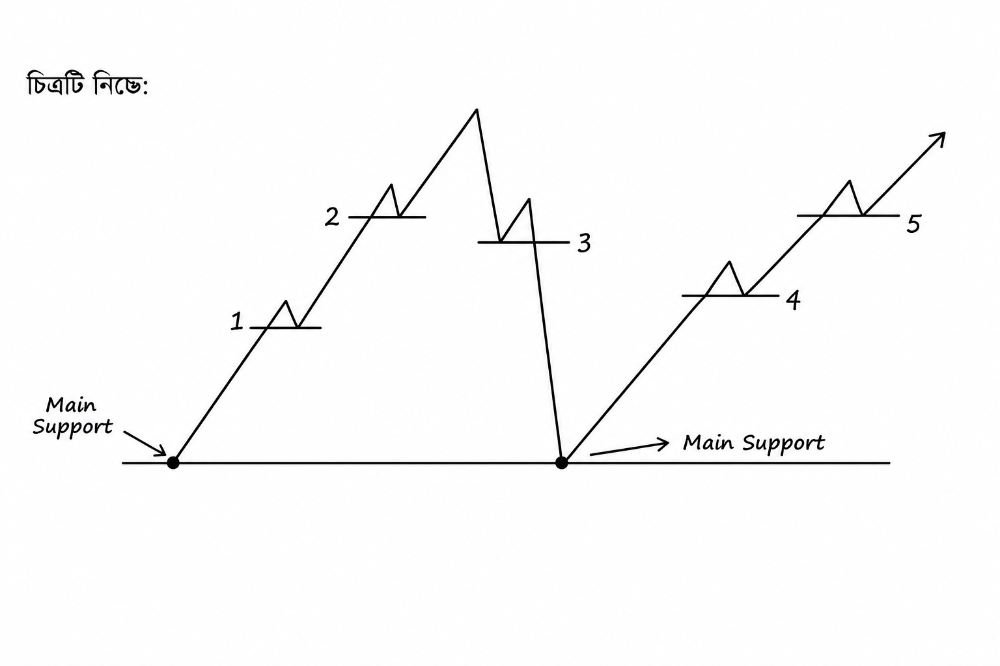
Through these support levels, the market moves upward, then after some time forms a new support and continues moving higher.
And when the market comes down for some reason, it touches or takes support from these strong support levels and then moves upward again.
Figure: The market is repeatedly taking support from different support levels as it moves upward.
Figure: For some reason, the market moves downward, takes support from the previous support level, and then goes upward again.
I hope after seeing the two figures above, you understood the topic.
Now let us come to resistance.
Resistance is exactly the opposite version of support. Its function is completely opposite.
If the support level is called the floor, then resistance is called the ceiling.
Now think about that mountain climbing example again. If, while climbing upward, there is another big mountain or a wall above me that blocks my way upward, then what will happen?
Surely, since I cannot go upward, I will come back down.
The exact same thing happens in trading or chart analysis.
When the market keeps moving upward by taking support, eventually it reaches a certain zone and faces a strong resistance, which acts like a ceiling or wall and does not allow the market to move higher.
Then the market also fails to move upward and comes back down again.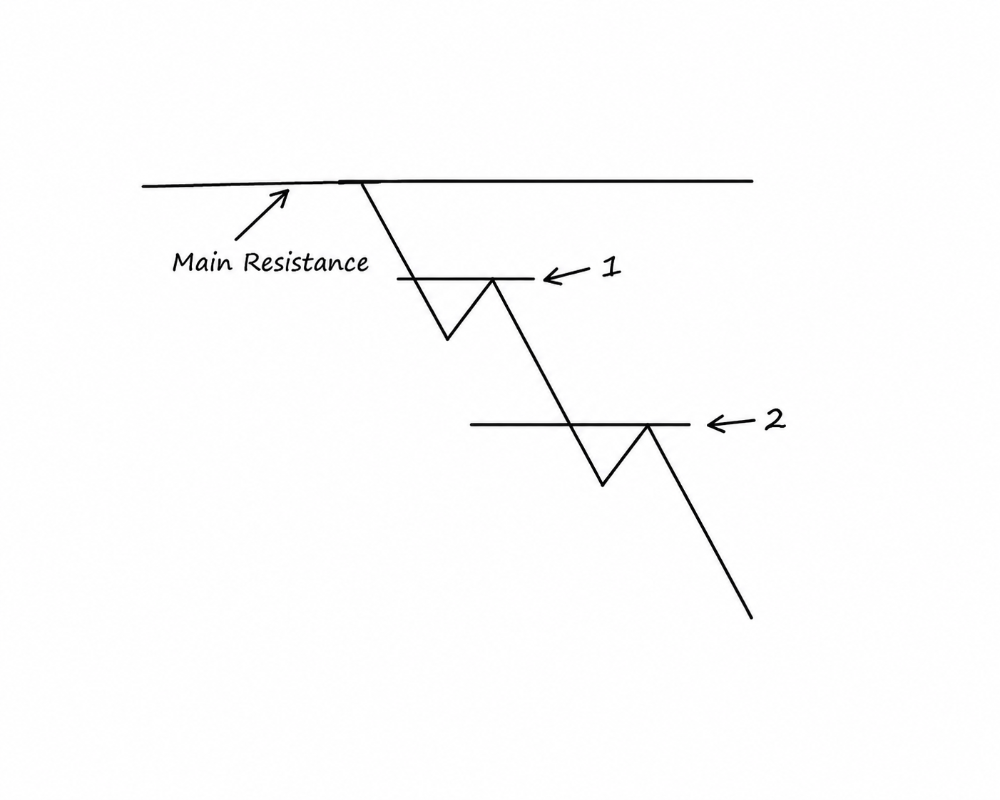
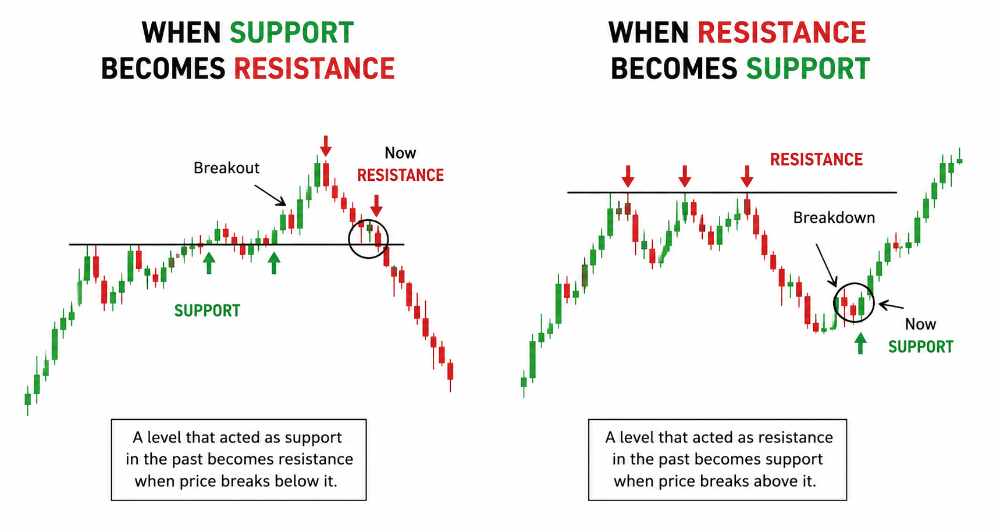
When Support Becomes Resistance and Resistance Becomes Support
Now let us come to the interesting part.
So far, we have learned about support and resistance.
Now we will learn about their transformation.
To make it easier to understand, let us go back to the mountain climbing story.
When I saw a huge rock blocking my way upward, I came back down, collected more equipment, and started climbing again.
Then, by using different strategies and tools, I successfully crossed that strong rock and moved above it.
After that, I took some rest to recover my energy and then, with new power, climbed even faster and reached the top of the mountain.
Now, this exact thing also happens in market charts.
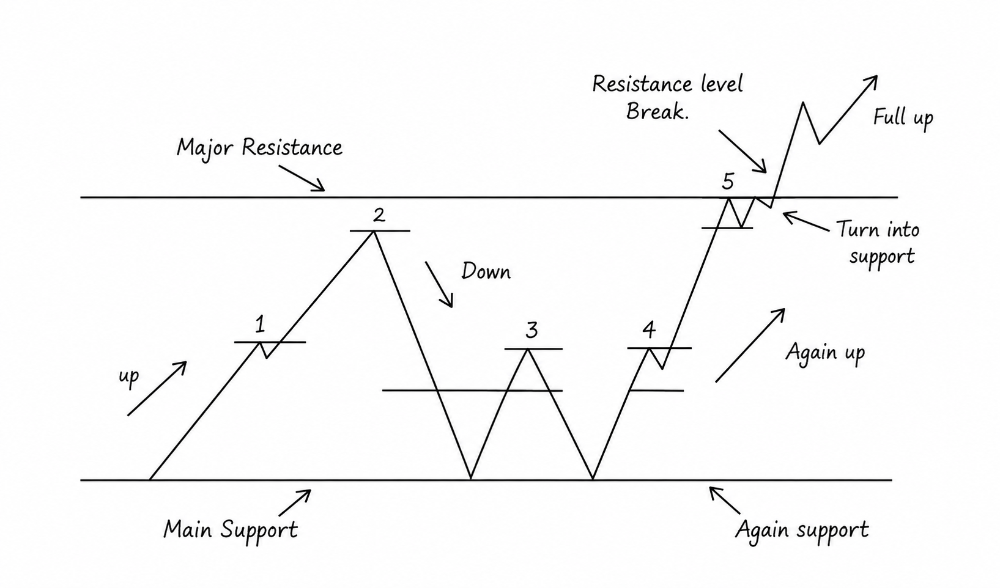
When the market faces a strong resistance and comes down, it takes support from the previous support level and repeatedly tries to break that resistance.
When it finally breaks through and moves above it, just like that big rock, the resistance turns into a support level.
Meaning, just like me, the market gains new power and starts moving upward even more strongly.
And this is how resistance turns into support.
If you look at the figure below, you will understand it more easily.
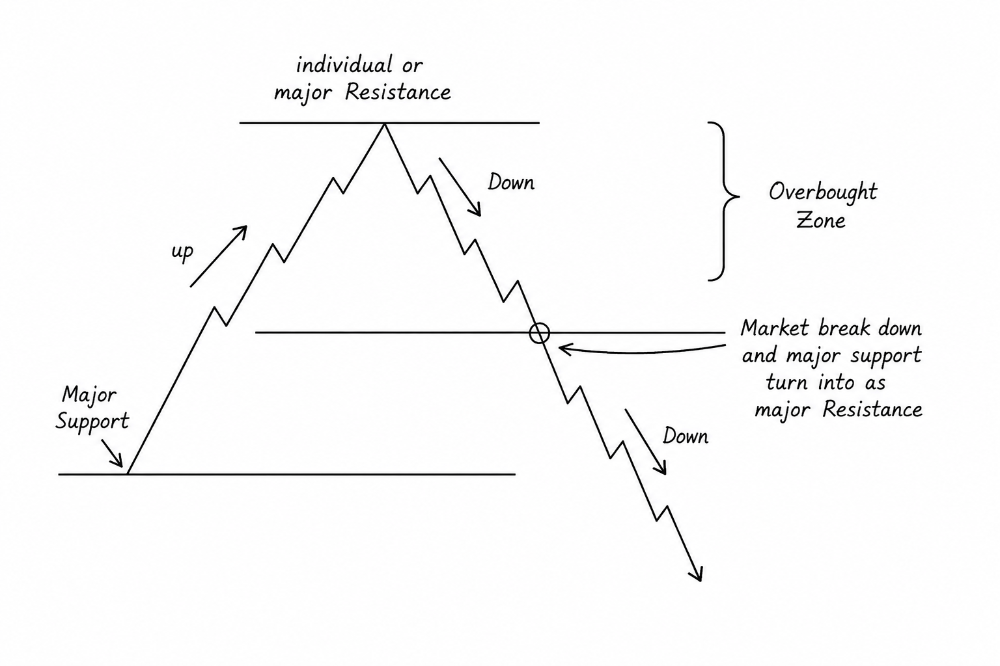
In the same way, whenever the market reaches an excessively bought or overbought zone, it becomes prepared for a reversal because of another invisible resistance.
At that point, when the market starts moving downward, it touches a support level and then breaks below it.
And that is when a strong support turns into a strong resistance.
As a result, the market faces double resistance and continues moving downward.
The figure below will make it even clearer.
I hope you understood the topic.
[There will be a more detailed discussion about this later.]
So now let us return to the previous discussion. As I mentioned before, when the market is in its specific zones, support can turn into resistance.
But if we look at the current chart situation, we can understand that the market is not overbought right now; rather, it is in the sold zone.
You may ask how I understood that.
The main reason is the RSI and the Fear and Greed Index.
First, let us talk about RSI.
If you observe the market now, you will see that for the last 3 weeks the RSI level has remained below 40.
Generally, RSI level 30 is considered the Over Sold zone.
But in the current BTC market, 40 itself is considered the Over Sold zone.
Anyway, since the market is at 40, meaning in the Over Sold zone, and the Fear and Greed Index is 15, which is in the Extreme Fear stage—
According to chart analysis rules, when RSI goes below 40 or enters the Over Sold zone and the Fear and Greed Index shows 15, meaning Extreme Fear, then the supply of BTC in the market becomes excessively high and people panic sell out of fear.
As a result, the market builds its base in the Over Sold zone.
And whenever this happens, no matter how long it takes, the market eventually reverses and moves upward again.
So since there is currently a strong support level at 62K, and RSI is below 40, currently at 34, meaning the Over Sold zone, and Fear is at 15, meaning Extreme Fear, that means the market is now at the bottom.
Therefore, the support level that exists will remain as support.
Even though the market closed after breaking the current support, it will still remain support.
Rather, it is giving an indication of a strong reversal.
Normally, the market stays in this Over Sold zone for at most 4 months.
But because the support level has been broken, it is indicating a stronger reversal.
As a result, the reversal will be completed within the next two months.
And BTC will break its ATH.
My Advice:
BTC will not suddenly rise at rocket speed. Its reversal will take some time.
Remember, you are not investing in a normal coin.
You are buying and selling a digital gold and a future global currency.
So because of different economic factors, geopolitics, and whale accumulation, its reversal takes time.
The main purpose of today’s discussion is to teach you patience from my side.
Many ordinary investors are panic selling because of excessive greed and fear.
The current market condition is a big test for you.
Usually, when the market stays this long and this low, it naturally creates fear.
As a result, most people panic sell and run toward altcoins and fall into the whales’ trap.
Meanwhile, whales collect all the BTC into their own pockets.
So the main thing here is patience.
If you have patience, you will survive.
If you do not have patience, you will fall out.
From today’s discussion, we can understand that breaking a support level does not mean the current market is down; rather, it is giving an indication of a strong reversal.
Besides that, chart analysts are also claiming that this is the preparation needed for the strong bull run required to break the ATH.
Whales are only testing ordinary people like you.
At the end of the day, the market will eventually move upward again.
So instead of falling into the whales’ trap, stay patient and remain in spot holding.
InshaAllah, you will become a companion in this historic bull run journey.
One more thing—regarding how whales test our patience, what strategies they use, and how geopolitics and economics are connected with BTC market reversals, I will provide links to some of my special articles below.
That will help you understand more clearly.
That is all for today.
We will meet again in another special discussion.
Until then, everyone stay well.
Assalamu Alaikum.
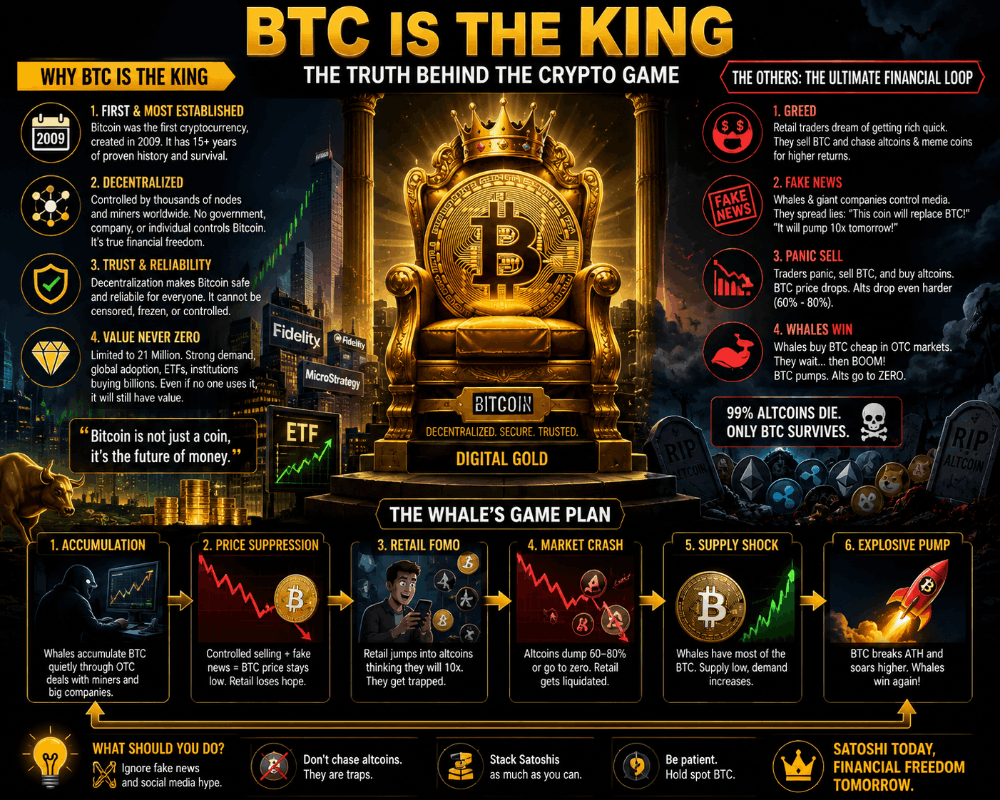
The Whales' Financial Loop: How Altcoins Are Designed to Trap You
clik this link
https://www.bulbapp.io/p/850a3dec-8e80-40bc-8fcb-dc811144336e/the-whales-financial-loop-how-altcoins-are-designed-to-trap-you
The Architectural Mechanics of Financial Markets And whale's Mindset
clik this link:
https://www.bulbapp.io/p/3b12bdc7-1eaf-4341-be9f-ce07e6eb6069/the-architectural-mechanics-of-financial-markets-and-whales-mindset