Ethereum: Will fresh demand again push ETH past $4K?

The daily count of new addresses created on the Ethereum network recently surged to a year-to-date high.

- New demand for Ethereum now sits at a year-to-date high.
- Its DeFi and NFT sectors, however, witnessed declines in the past week.
The daily count of new addresses on Ethereum [ETH] assessed on a seven-day moving average reached a year-to-date (YTD) high of 116,000 on 14th March, according to The Block’s data dashboard.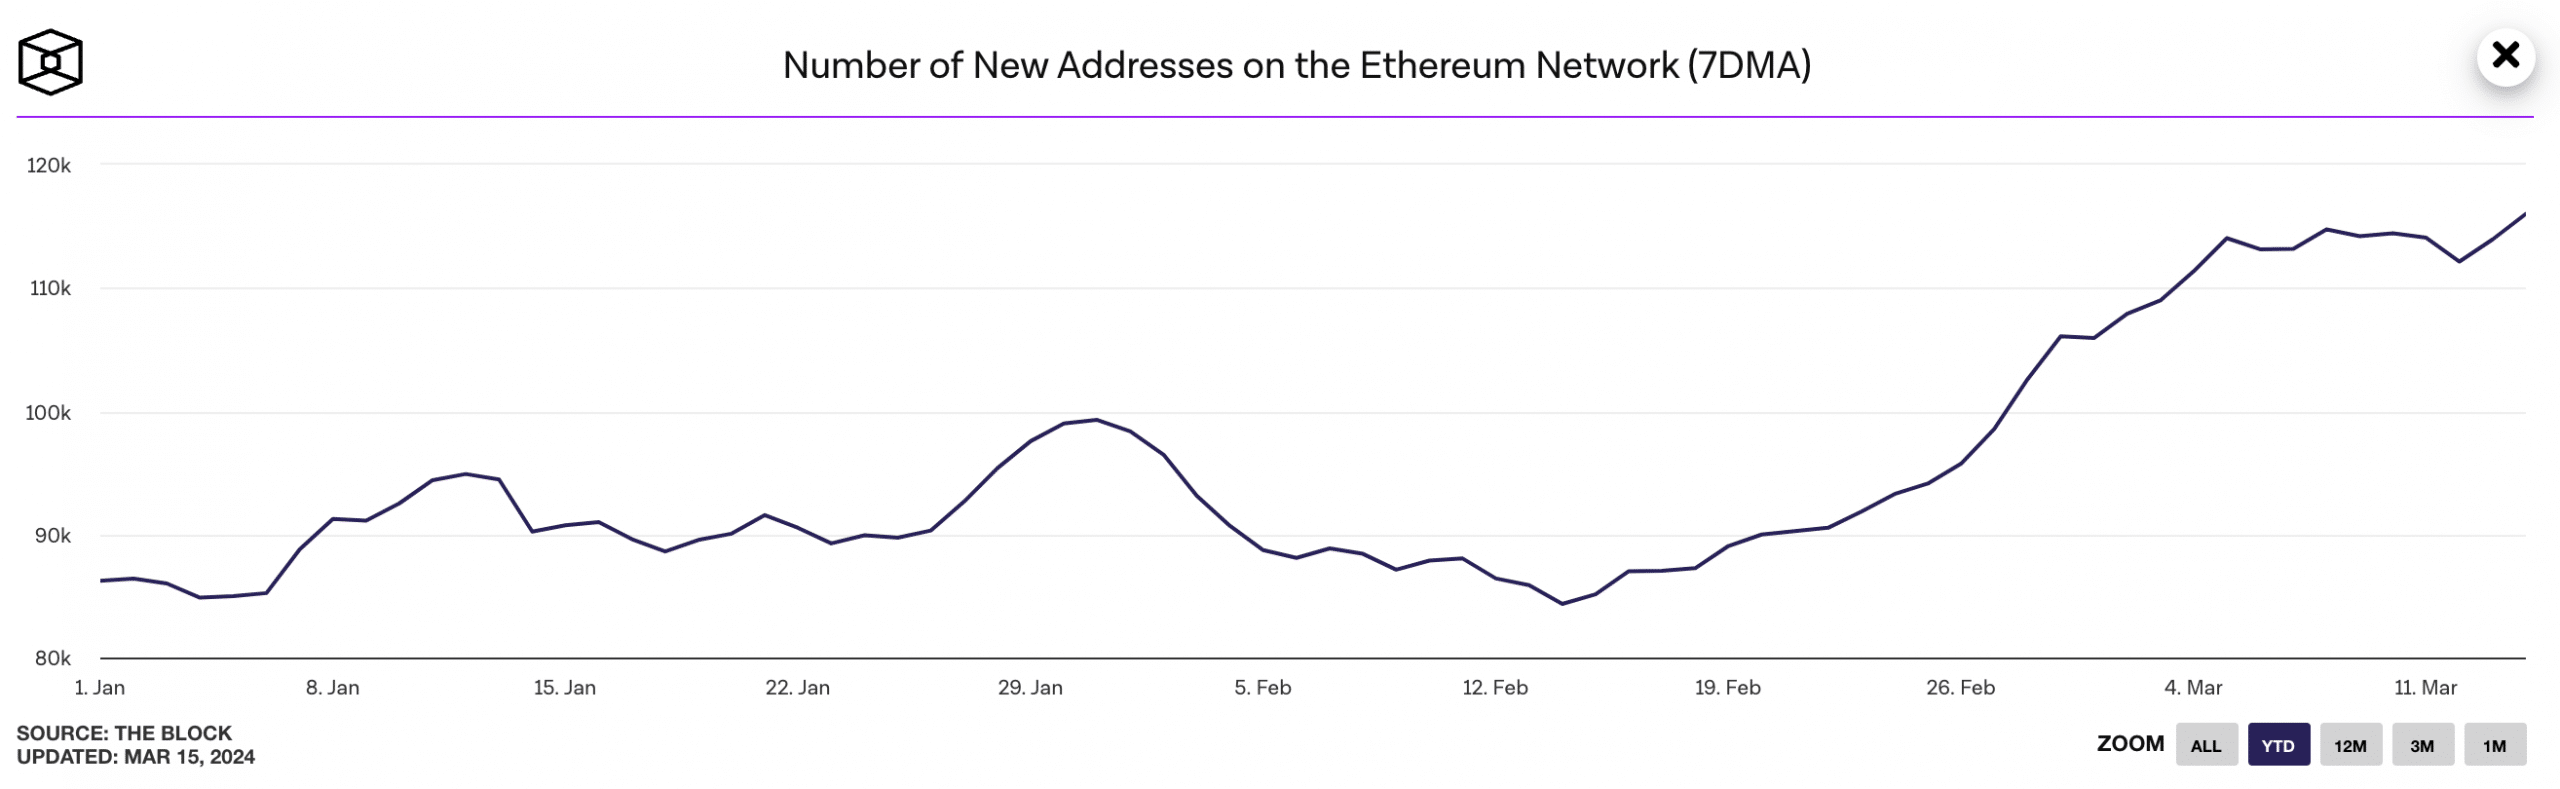 Source: The Block
This marked a 35% increase from the 86,000 unique addresses that appeared for the first time in a transaction of the native coin in the network on 1st January.
Ethereum’s rally in new demand to a YTD high came amidst a surge in its on-chain volume. AMBCrypto found that transaction volume on the network, also assessed using a seven-day moving average, attained a YTD high of $7 billion on 11th March.
As transaction volume rallied, the average fee paid per transaction on the network also climbed. According to The Block’s data, this reached a YTD high of $25 on 11th March. ![]() Source: The Block
Source: The Block
The DeFi and NFT sector fails to react
Despite the recent uptick in demand for the Ethereum network, its decentralized finance (DeFi) and non-fungible token ecosystems have witnessed declines.
For example, the total value of assets locked (TVL) across the DeFi protocols housed within the chain declined by 5% in the last week. Per DefiLlama’s data, Ethereum’s TVL was $53.4 billion.
Out of the top 10 DeFi protocols on Ethereum, only one (ether.Fi) recorded a TVL hike in the past seven days. The rest of them witnessed a decline.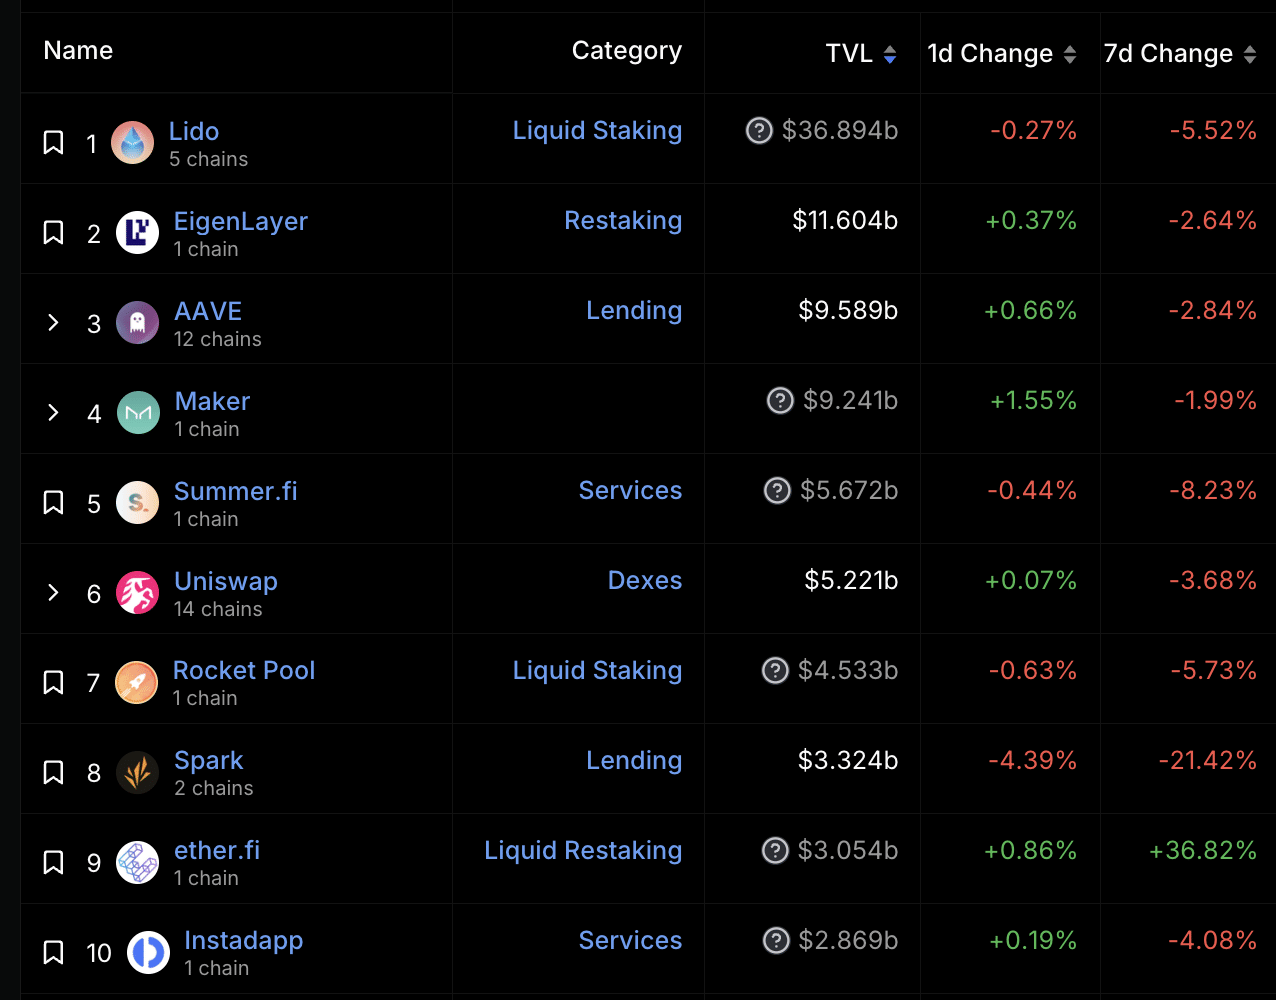 Source: DefiLlama
The network’s NFT sector recorded a 21% decrease in sales volume in the last seven days.
According to CryptoSlam’s data, despite the 90% uptick in the number of traders trading NFTs on the network during that period, the transaction count fell by 2%.
In the last seven days, 166,000 NFT transactions worth $130 million were completed on the Ethereum network.
Look before you leap
The network’s native coin ETH sold for $3,721 at press time. Per CoinMarketCap’s data, its value dropped by 6% in the last week. The decline followed a sharp fall in Bitcoin’s value on 14th March, when its value was below $68,000.
How much are 1,10,100 ETHs worth today?
An assessment of ETH’s performance on a daily chart revealed that its Awesome Oscillator (AO) indicator has posted red upward-facing histogram bars since 11th March.
An asset’s AO measures market trends and changes in momentum. When it displays red upward-facing bars, it suggests increasing negative momentum in the market. Traders often interpret this as a signal to consider selling or entering short positions.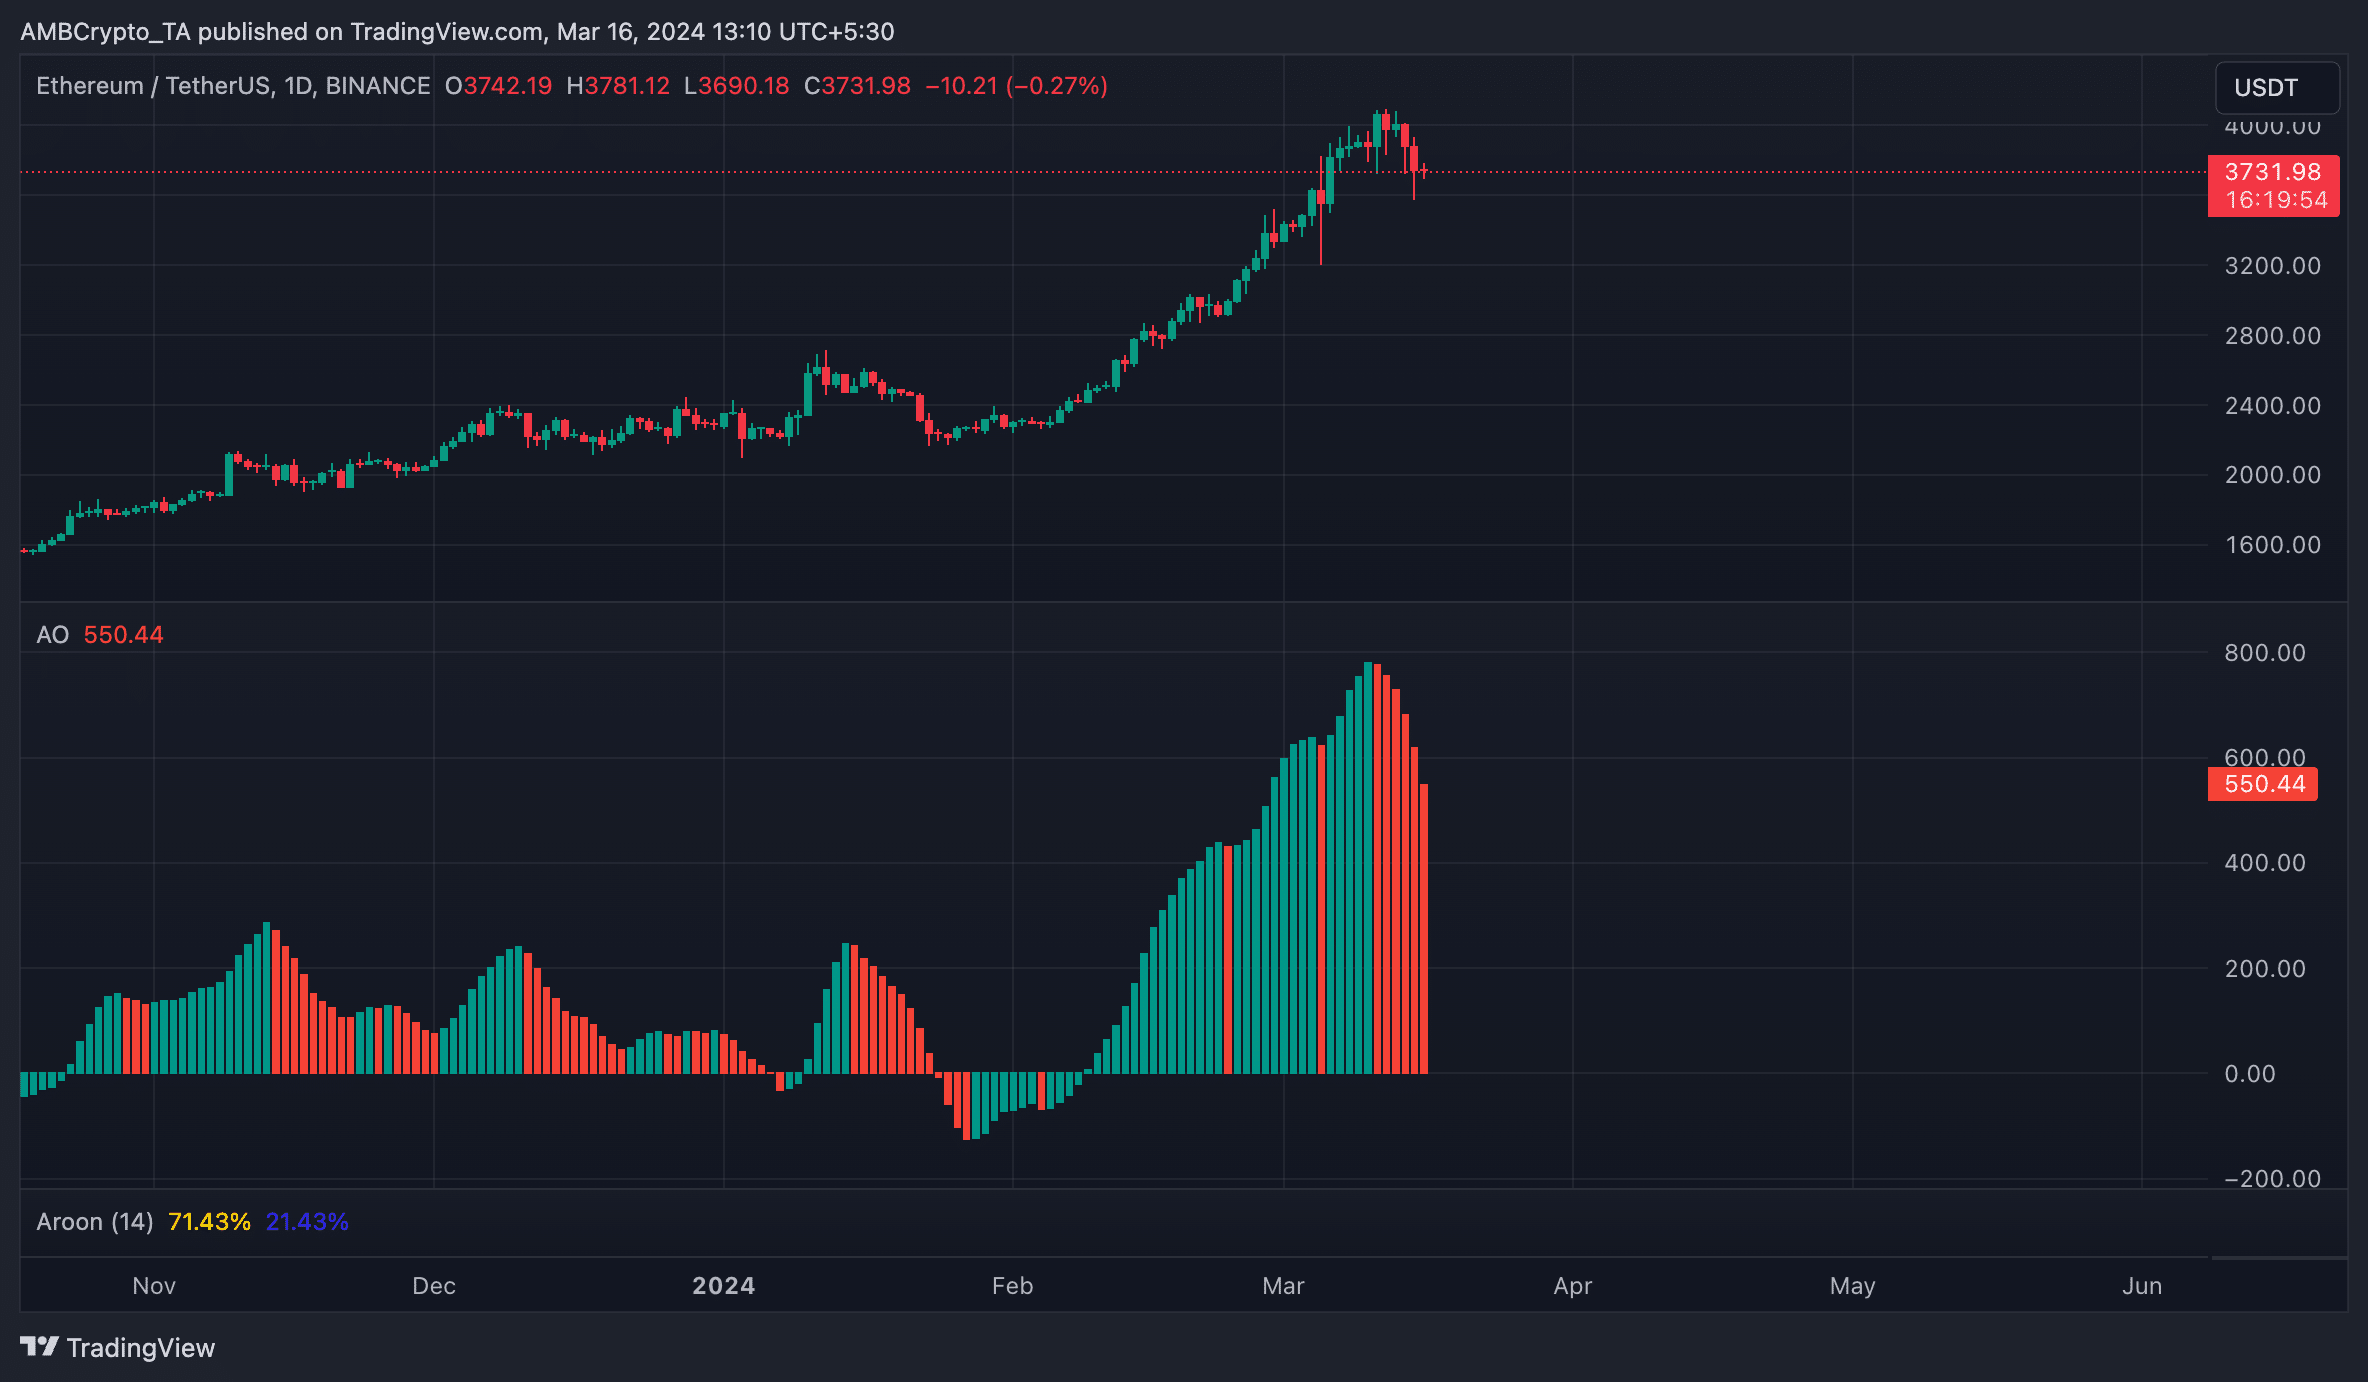
Solana is up 13% in 24 hours - Here are the reasons why
2min Read
With the latest surge, Solana became the third-largest DeFi chain.
- SOL maintained a bullish narrative despite broader market sell-offs.
- Solana recorded the highest stablecoin transfers in the first three months of 2024.
Solana [SOL] defied the broader market bleeding to post an impressive show at the price charts. The fifth-largest cryptocurrency gained 13% in the last 24 hours, and over 27% during the week, even as Bitcoin’s [BTC] flash dump triggered a broader market sell-off.
The outperformance catapulted SOL to the top of LunarCrush’s AltRank metric recently, underscoring higher social engagement with the coin. A higher rank on the metric, which measures a cryptocurrency’s community and traction, is often a signal to retail investors to pay attention to the asset.
Solana becomes No.3 in DeFi
The jump in prices boosted the USD value of the deposits on the Solana blockchain. According to AMBCrypto’s analysis of DeFiLlama’s data, the total value locked (TVL) rose 8.19% in the last 24 hours to $7.59 billion.
With the latest surge, Solana became the third-largest decentralized finance (DeFi) chain, surpassing BNB Chain [BNB] for the first time ever.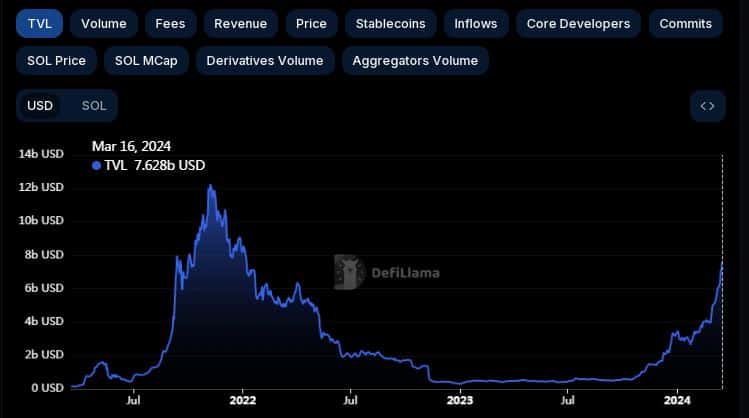 Source: DeFiLlama
Recall that Solana’s fortunes were hit badly in the fall of 2022, owing to its exposure to the now-fallen cryptocurrency exchange FTX [FTT].
The TVL crashed as low as $300 million with little improvement seen during much of 2023. Solana DeFi was declared dead by many critics at this time.
However, things changed dramatically from October 2023, resulting in a 13x jump in TVL until press time. AMBCrypto reported how crucial partnerships and robust on-chain fundamentals aided the turnaround.
Stablecoin transfers surge
Apart from TVL growth, Solana also took the lead in terms of on-chain stablecoin volume.
As per AMBCrypto’s analysis of Artemis’ data, Solana recorded the highest volumes in the first three months of 2024, leapfrogging traditional powerhouses such as Ethereum [ETH] and Tron [TRX].
Solana’s ascension implied its growing stature as the go-to network for stablecoin settlements.![]() Source: Artemis
Source: Artemis
How much are 1,10,100 SOLs worth today?
What is SOL’s “future?”
AMBCrypto investigated SOL’s futures market using Coinglass’ data and discovered a positive funding rate. This meant that long positions were paying fees to short positions, implying a dominance of the former.
Interestingly, SOL’s Open Interest (OI) didn’t show a notable rise as like price, growing barely by 0.36% in the last 24 hours.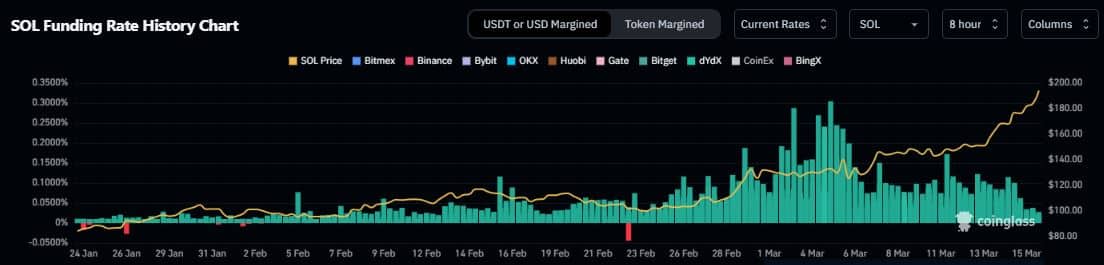 Source: Coinglass
Previous: Ethereum: Will fresh demand again push ETH past $4K?
Next: Bitcoin: How a surge on this front could be ‘dangerous’ for BTC
Read the Next Article
Bitcoin: How a surge on this front could be 'dangerous' for BTC
2min Read
The surge in funding rates comes at a time when the market is overly “greedy.”

- Bitcoin perpetual swaps funding rates have rallied to multi-year highs on Binance and Bybit.
- The Crypto Fear & Greed Index showed that the market is in a state of extreme greed.
Bitcoin [BTC] borrowing costs on leading cryptocurrency exchanges like Binance and Bybit have reached their highest point since 2021, IntoTheBlock noted in a recent post on X (formerly Twitter). This indicates a surge in leveraged trading.
According to the on-chain data provider, on 14th March, BTC perpetual swaps funding rates on Binance and Bybit recorded highs of 0.06% and 0.09%, respectively.
High Leverage equals high funding rates
Perpetual swaps are a type of derivative contract that allows traders to speculate on the price of an asset without actually owning it.
The funding rate is a fee exchanged between traders to ensure that the price of the perpetual contract stays close to the spot price of the underlying asset.
When an asset’s funding rates surge, as in this case with BTC, it suggests that there’s an unusually high demand for long positions compared to short positions. This indicates that more traders are betting on the price of BTC increasing than those betting on it decreasing.
Although this commonly indicates the presence of significant bullish sentiment in the market, the volume of trades executed using high leverage also means that the market is overheating.
High-leverage trading often reflects market sentiment. If traders are highly bullish and are using leverage to open long positions, this sentiment can drive up the funding rates.
How much are 1,10,100 BTCs worth today?
However, an unabated rally in BTC’s funding rates poses certain risks. As per the findings shared by a pseudonymous CryptoQuant analyst in a report dated 6th March, the analyst emphasized the consequences of a surge in the funding rates of an asset.
“However, while rising funding rates typically accompany a bullish market sentiment, excessively high values can be dangerous. Elevated rates increase the risk of long liquidation cascades, which may result in heightened market volatility and unexpected corrective movements.”
Moreover, this surge in funding rates comes at a time when the market is overly “greedy.” As of this writing, the Crypto Fear & Greed Index is 81, indicating that the market remained in a state of extreme greed.
A market driven by extreme greed is often at risk of sudden reversals, as sentiments can shift quickly. Negative news or a change in market dynamics could trigger a sell-off as investors rush to cut their losses, leading to a market correction.
At press time, BTC exchanged hands at $69,000, per CoinMarketCap’s data.
Previous: Solana is up 13% in 24 hours – Here are the reasons why
Next: Will XRP’s price see another 8% drop? New predictions suggest…
AVAX prices see weekly gains of 36% – Predictions coming true?

- Avalanche’s liquidation will increase if its price touches $61.4.
- Market indicators looked bearish on the token.
Avalanche [AVAX] caught investors off guard as it decoupled from the entire crypto market in the last few days. Therefore, let’s have a closer look at the token’s metrics to see what is causing AVAX to act differently from the rest.
Avalanche bulls are here
While most cryptos suffered losses because of the recent bearish market condition, AVAX moved the other way around. According to CoinMarketCap, AVAX was up by more than 40% in the last seven days.
In fact, in the last 24 hours alone, the token’s value surged by over 22%. At the time of writing, AVAX was trading at $60.18 with a market capitalization of over $22 billion. The good news was that the token’s trading volume also surged by 35% in the last 24 hours, acting as a foundation for the price uptick.
Thanks to the bull rally, Avalanche’s 1-week price volatility spiked substantially. Moreover, positive sentiment around the token was also high, meaning that investors were confident in AVAX’s bull rally and expected its value to surge further.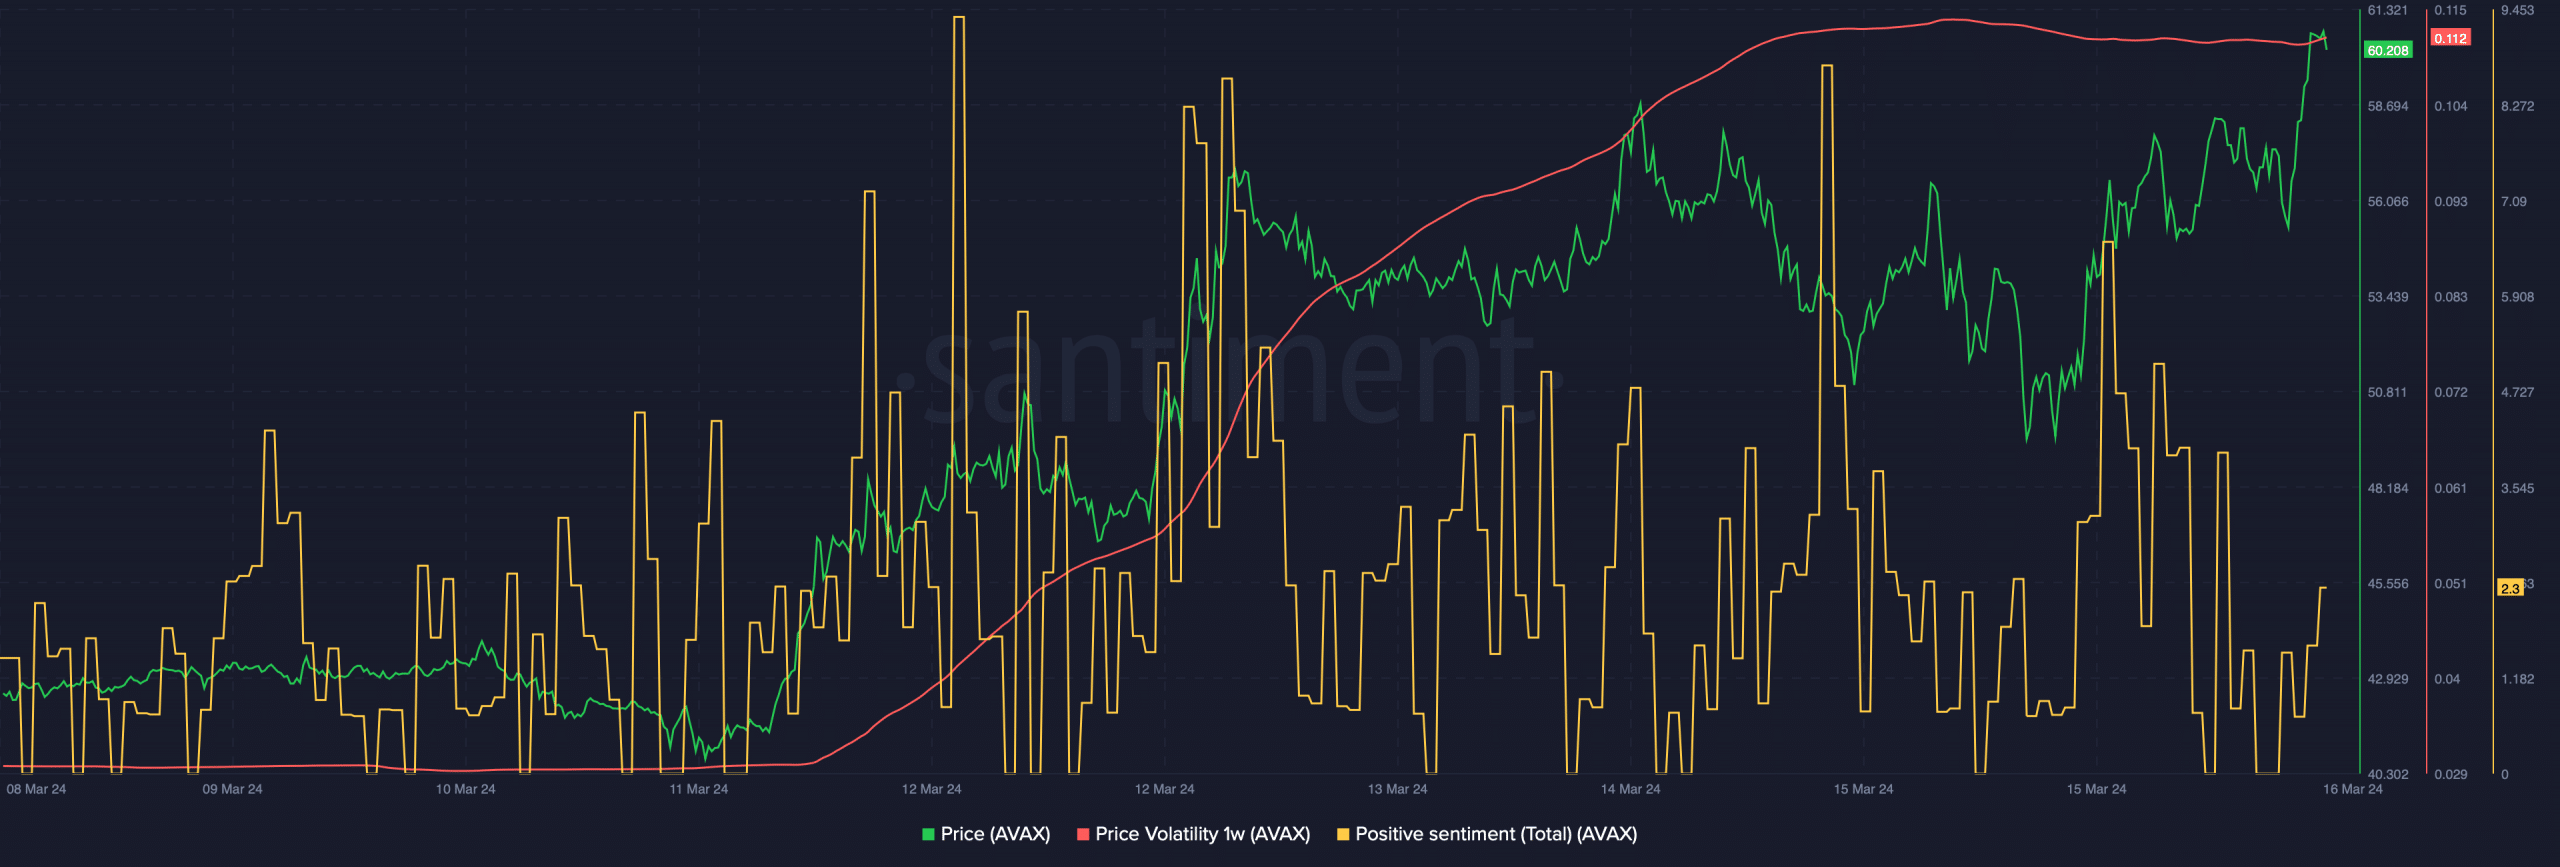 Source: Santiment
Things in the derivatives market also looked pretty optimistic. AMBCrypto’s analysis of Coinglass’ data revealed that AVAX’s funding rate increased, suggesting that derivatives investors were actively buying the token.
Additionally, its open interest also went up along with its price. Whenever the metric moves up, it increases the chances of the current price trend continuing further.
High liquidation ahead
Though the aforementioned metrics look bullish, AVAX will witness high liquidation if its rice moves up.
To be precise, an analysis of Hyblock Capital’s data revealed that Avalanche’s liquidation will rise when its price touches the $61.5 and $62 marks.
High liquidation means a rise in selling pressure, which might put an end to the token’s bull rally. 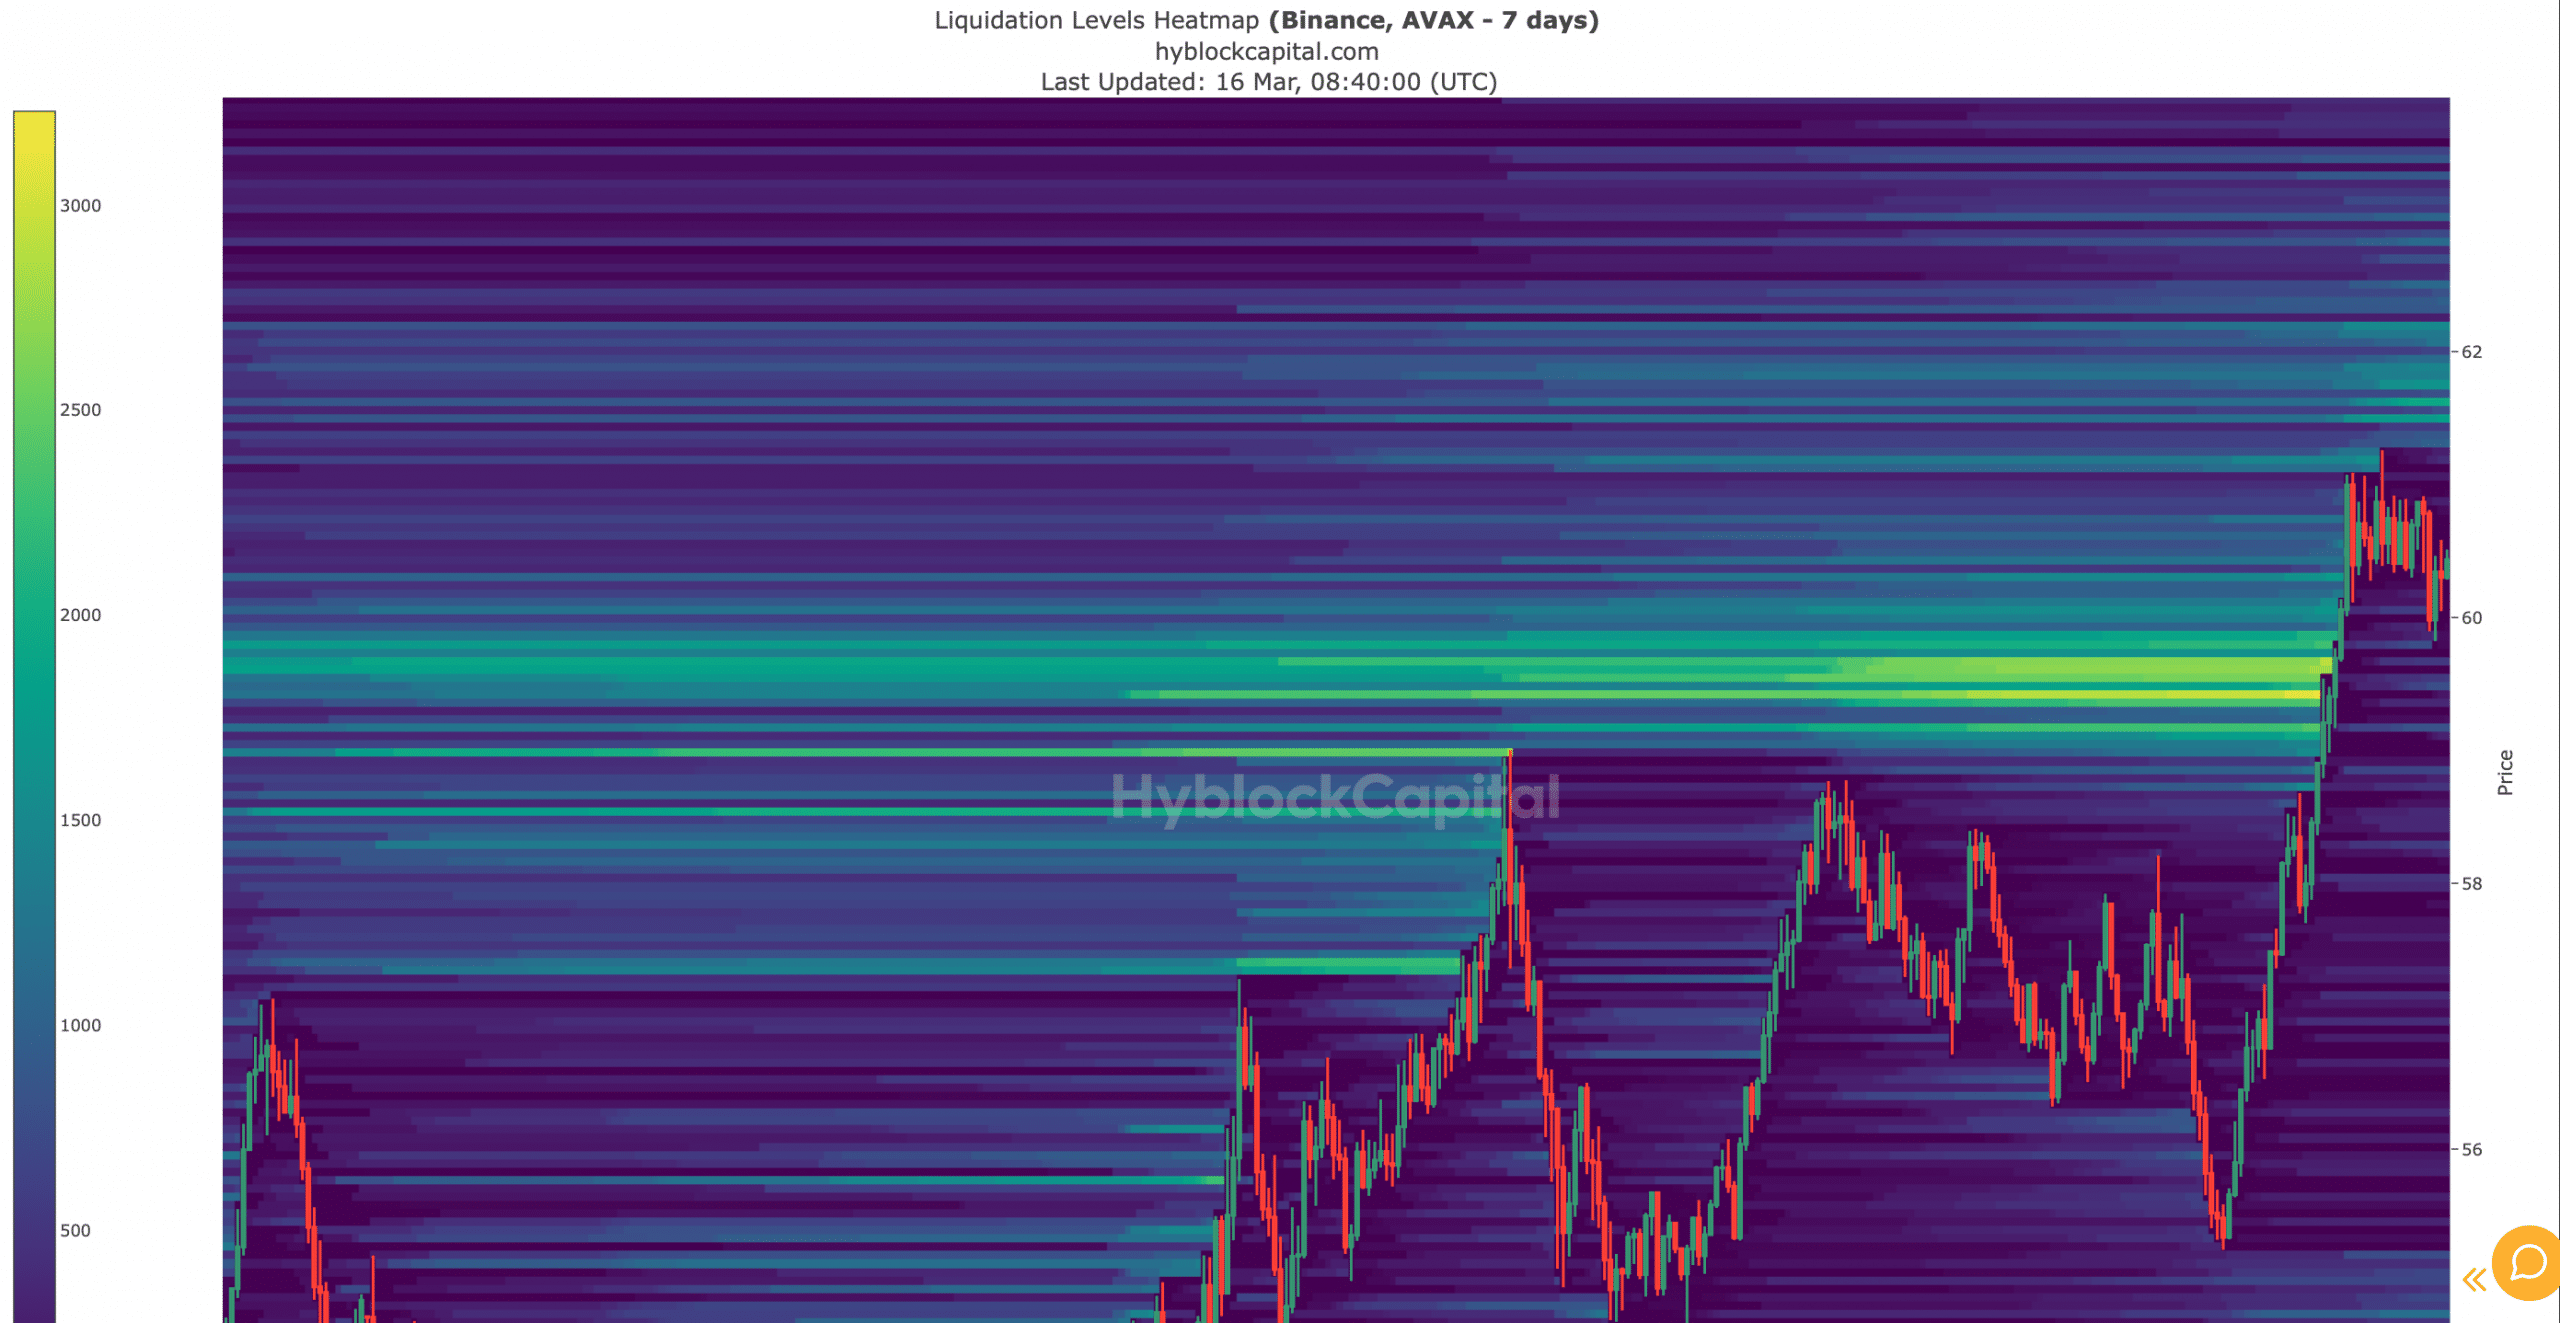 Source: Hyblock Capital
To better understand whether AVAX will manage to sustain its rally, AMBCrypto took a look at its daily chart. We found that the token’s price touched the upper limit of the Bollinger Bands.
Read Avalanche’s [AVAX] Price Prediction 2024-25
On top of that, Avalanche’s Relative Strength Index (RSI) also entered the overbought zone. Both of these metrics indicated that selling pressure on AVAX might rise, which can cause a price correction in the near term.
Nonetheless, the MACD remained in buyers’ favor as it displayed a bullish advantage in the market.