Bitcoin Volatility Has Already Been Changing


January 11, 2024, was an historic day within the exchange-traded fund (ETF) industry, as it marked the first time ETFs tracking the spot price of bitcoin were allowed to trade.
The competitive forces of how many launches come at once brought down execution costs, as a number of firms, including WisdomTree, waived management fees to zero for the first six months.
Some discussion we’re hearing:
- The first gold ETF traded in the U.S. market on November 18, 2004.1 Gold’s market capitalization was estimated to be roughly $1.7–$1.8 trillion around this time, growing to about $14 trillion nearly 20 years later.2 Gold’s path does not guarantee anything regarding bitcoin, but there’s a parallel in that investing and storing gold as physical bars is not as easy as buying shares in an ETF.
- Acceptance of an asset class within the ETF structure: ETFs have garnered over $8 trillion of AUM in the U.S.3 The first filings for a spot bitcoin ETF date back to 2013,4 but the market structure itself needed time to mature. ETFs help take that maturity of bitcoin another step further.
- Volatility: One of the measurable things that everyone can see is the volatility of bitcoin’s price. Volatile assets are often considered riskier than less volatile assets since the asset’s price is expected to be less predictable. With that said, we are talking about an asset that delivered roughly 50% average annual returns over the past 10 years at a level of something close to 80% annualized volatility.5 Broad equity benchmarks, like an S&P 500 Index, would be below 20% annualized volatility over this same period. There are many investors that might see the 50% average annual return, but that would not be able to live with the 80% annualized volatility.
Bitcoin’s Volatility Trends
Brent Donnelly, a friend of ours at Spectra Markets, put out some interesting charts that we reference here.6 Brent showed bitcoin’s price volatility has been declining for a significant period, and this has had nothing to do with ETFs. The market itself has been maturing, prices and market cap have been rising, and more participants trading and investing, which have all brought down the volatility.
In figure 1, we see:
- The horizontal axis represents the market capitalization of bitcoin in billions of U.S. dollars. The 2014 peak saw the market capitalization around $1 billion, then the late-2017 peak was above $10 billion—getting toward $50 billion. The 2021 peak was around $1 trillion. One can see that this is a logarithmic scale and not a case where one line represents one unit—it is a far faster increase than that.
- The pattern of trading in bitcoin has been one of peaks and troughs, with the troughs sometimes labeled as winters. There have been periods with big swings upward in price, and then there have been these other, colder periods. At each time, you can look back at a market capitalization chart and note when there were these different near-term peaks that were followed by the so-called crypto-winters.
- The vertical axis represents the 90-day annualized volatility. The number 150 refers to 150%—a very high level. The 2021 bubble peak is roughly halfway up the scale on the vertical, relative to the 2014 peak. This is telling us that even if 2021 was also a bubble peak, the volatility in bitcoin’s price was much lower in 2021 than it was seven years earlier.
Figure 1: Bitcoin’s Market Capitalization vs. Volatility, Marking Different Market Cap Peaks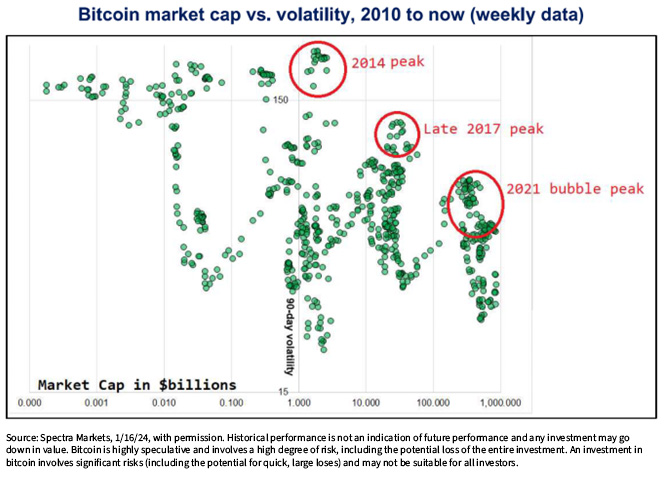
In figure 2:
- The volatility of any asset, bitcoin included, is not constant. One must always specify a time frame to make the calculation and recognize that if one rolls that calculation forward or backward in time, the figure can move up or down. In 2014, there was a 90-day period that saw bitcoin’s price volatility above 200%. However, that reading has not really been approached since that unique point. It doesn’t mean it couldn’t go back to those levels—it is just not the observed trend.
- In 2023, it’s clear that the 90-day volatility of bitcoin’s price was below 50%. We cannot state with certainty it will stay there or it must be there—but that is a big difference from what was observed earlier in the time series.
Figure 2: Time Series Data for 90-Day Bitcoin Volatility, 2011 to Present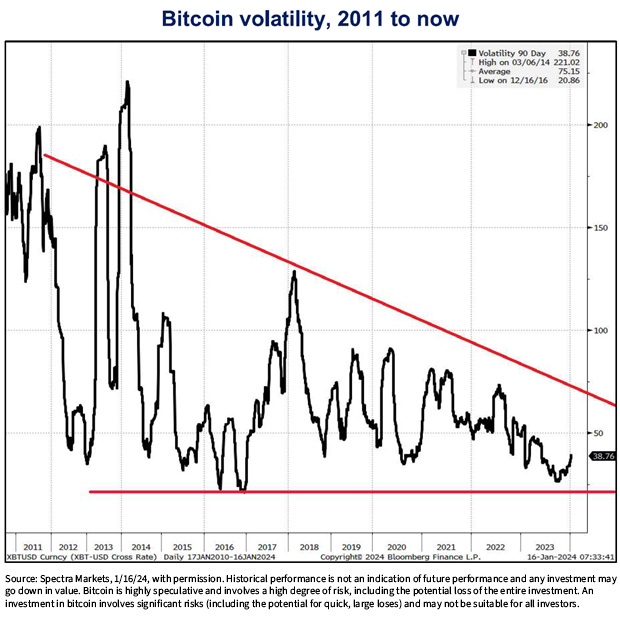 Conclusion: Multiple Signals Tell Us Bitcoin Is Maturing As an Asset Class
The fact that spot bitcoin exposure is available in the ETF structure was an important milestone, but it was just one among an array of signals that indicate bitcoin as an asset class is on its journey toward maturation. We believe one important signal is volatility, which has historically been trending downward.
This will be one of the signals we continue to watch, and we thank Brent Donnelly for assembling such clean, clear depictions of the story in this case.
Source-https://www.wisdomtree.com/investments/blog/2024/02/05/bitcoin-volatility-has-already-been-changing


