Comparing Historical Performance of Gold, NASDAQ, S&P 500, and Bonds

For centuries, investors have sought the path to wealth across diverse landscapes. Some favor the glittering promise of precious metals, while others navigate the dynamic terrain of stocks and bonds. This article delves into the historical performance of four prominent investment options: gold, NASDAQ, S&P 500, and bonds, offering a comparative analysis to guide your financial journey.
The Enduring Allure: Gold
Gold A symbol of wealth and stability for millennia, gold has long held a unique position in investment portfolios. Its intrinsic value and limited supply often serve as a hedge against inflation and economic uncertainty. However, historically, its price appreciation has been modest, averaging around 3% annually over the past century. While offering diversification and crisis protection, gold may lag behind other investments in terms of long-term growth.
The Tech Titan: NASDAQ
NASDAQ
Home to tech giants like Apple, Amazon, and Microsoft, the NASDAQ Composite Index represents the dynamic world of technology stocks. This sector has experienced explosive growth in recent decades, with the NASDAQ averaging a remarkable 13% annual return over the last 20 years. However, this growth comes with heightened volatility, making the NASDAQ susceptible to market swings and economic downturns.
The Market Barometer: S&P 500
S&P500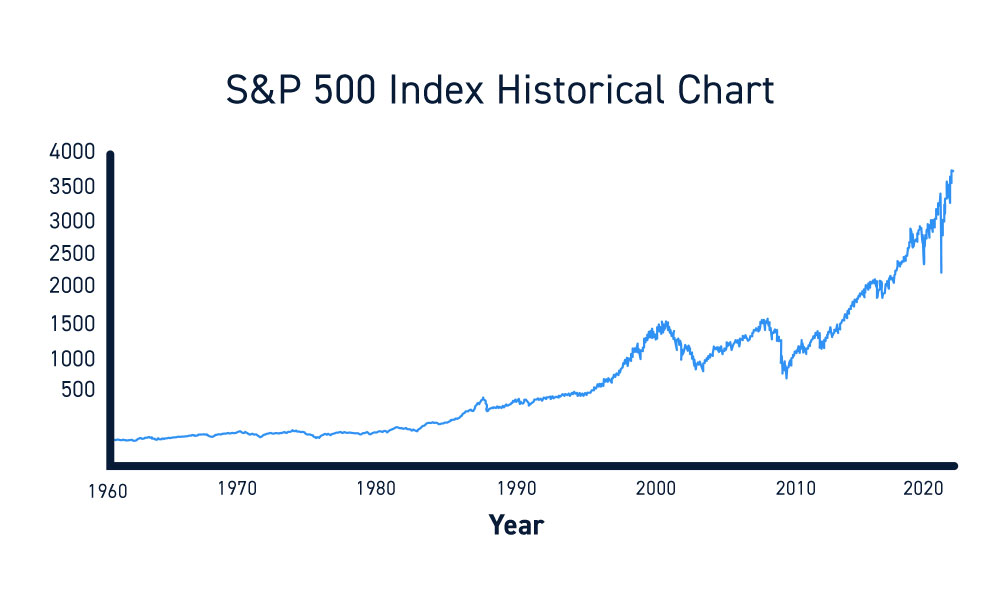
Encompassing 500 of the largest US companies across various sectors, the S&P 500 serves as a broad indicator of the US stock market's health. It offers a balance between risk and reward, historically delivering an average annual return of around 10% over the past century. However, similar to the NASDAQ, the S&P 500 experiences market fluctuations, requiring a long-term investment horizon.
The Steady Stream: Bonds
Bonds:max_bytes(150000):strip_icc()/what-are-bonds-and-how-do-they-work-3306235_V3-cc55a8d3b82d4d34a991d6cc4fa8a865.png)
Bonds represent loan agreements between investors and borrowers, offering a fixed rate of return over a set period. They provide stability and income, particularly government bonds, but their returns are often lower than stocks. Historically, investment-grade corporate bonds have delivered an average annual return of around 5%, while US Treasury bonds have averaged closer to 3%.
The Verdict: Diversification is Key
Diversification:max_bytes(150000):strip_icc()/diversification.asp-FINAL-b2f2cb15557b4223a653c1389389bc92.png)
While each investment possesses distinct advantages and disadvantages, a crucial takeaway lies in strategic diversification. Combining assets across different categories can mitigate risk and smooth out the bumps in the financial road. Consider your individual risk tolerance, investment goals, and time horizon when crafting your personalized portfolio.
Remember: Past performance is not necessarily indicative of future results. This article presents historical data for informational purposes only and should not be construed as financial advice.
Beyond the Numbers: Additional Considerations
- Investment fees: Management fees and trading costs can erode returns, so compare options carefully.
- Taxes: Different investments are subject to varying tax implications. Consult a tax advisor for guidance.
- Global diversification: Expanding your portfolio beyond domestic markets can further mitigate risk.
By understanding the historical trends and characteristics of each investment, you can make informed decisions and embark on a rewarding financial journey.


