The Real Reason Crypto Markets Move: Understanding Market Liquidity

If you read mainstream financial news, they will tell you that crypto prices move based on a long list of complicated factors. One day it’s a change in Federal Reserve interest rates. The next day it’s a political statement, a corporate announcement, or a sudden spike in institutional ETF inflows.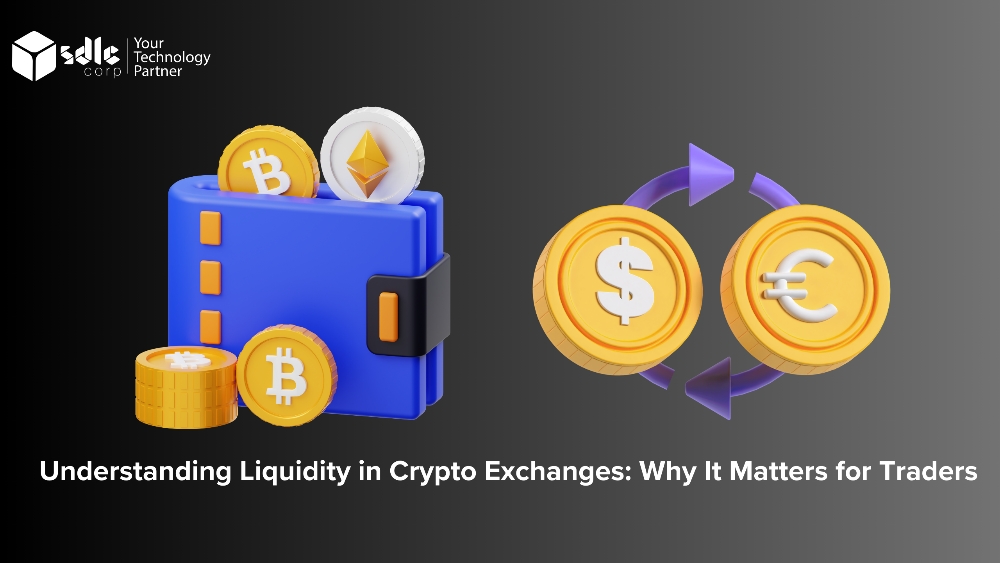
If you want to survive as an investor and write content that resonates on platforms like BULB, you have to stop looking at individual news events and start tracking the global tide of money.
What is Liquidity, Exactly?
In plain terms, liquidity is simply the availability of cash in a market. It is a measure of how easily you can buy or sell an asset without drastically changing its price.
Think of a crypto asset like a bucket of water.
- High Liquidity: The bucket is a massive swimming pool. If you drop a massive boulder into it (a multi-million dollar buy or sell order), the water level barely moves. The price remains stable, and trading is smooth.
- Low Liquidity: The bucket is a small teacup. If you drop that same boulder into a teacup, the water splashes everywhere. A single large trade can cause the price to instantly skyrocket by 50% or crash to zero.
When global liquidity is high—meaning central banks are printing money, interest rates are low, and investors have plenty of spare cash—that money naturally flows into riskier assets like technology and crypto. When liquidity dries up, the exact opposite happens.
The Illusion of Demand
We recently witnessed a perfect real-world example of this dynamic. In early June 2026, Bitcoin experienced a sudden, sharp 15% correction, dragging down major altcoins with it. Mainstream media immediately scrambled to blame geopolitical headlines and macroeconomic policy.
But on-chain data revealed a much simpler truth: the buyers just disappeared.
For months, massive inflows into spot Bitcoin ETFs had been pumping liquidity directly into the market. When those ETF flows cooled down and shifted into traditional U.S. tech stocks, the underlying liquidity dried up. There wasn’t a wave of panic selling or a breakdown of blockchain security. It was simply a case of insufficient liquidity to absorb the normal, everyday selling pressure of the market.
Why You Must Trace the Capital
Most retail traders focus entirely on technical charts, drawing lines to predict where a price will go next. But a chart pattern is just a historical map of where liquidity used to be.
To win the game, you have to follow where the capital is actively moving. Is it flowing into decentralized physical infrastructure (DePIN)? Is it rotating into tokenized real-world assets (RWAs)? Or is it being hoarded in stablecoins on the sidelines?
When you learn to look at Web3 through the lens of global liquidity rather than emotional headlines, the market stops looking like an unpredictable casino. It starts looking like a predictable tide—and your only job is to ride the wave.