SOL Price Surges To $115 – Why Solana Could Rally Another 10%

Solana is gaining bullish momentum above $110. SOL price is surging, and the bulls could soon aim for a move above the $120 level.
- SOL price started a fresh increase from the $95.00 support against the US Dollar.
- The price is now trading above $105 and the 100 simple moving average (4 hours).
- There is a key bullish trend line forming with support at $109.20 on the 4-hour chart of the SOL/USD pair (data source from Kraken).
- The pair could continue to rally if it clears the $115 and $118 resistance levels.
Solana Price Starts Fresh Rally
Solana price formed a base above the $94.00 support zone and recently started a fresh increase. There was a decent increase above the $98 and $100 levels.
The price is up nearly 10% and there was a move above the $110 level, outperforming Bitcoin and Ethereum. The bulls pushed the price close to $115. A high is formed near $114.98 and the price is showing no signs of upside exhaustion.
No KYC Casino and Sportsbook with up to 300% match bonus + 175 Free Spins, and Wager Free Cashback. Play now at ROLR.IO!
It is holding gains above the 23.6% Fib retracement level of the recent wave from the $103.38 swing low to the $114.98 high. Solana is now trading above $110 and the 100 simple moving average (4 hours).
There is also a key bullish trend line forming with support at $109.20 on the 4-hour chart of the SOL/USD pair. The trend line is near the 50% Fib retracement level of the recent wave from the $103.38 swing low to the $114.98 high.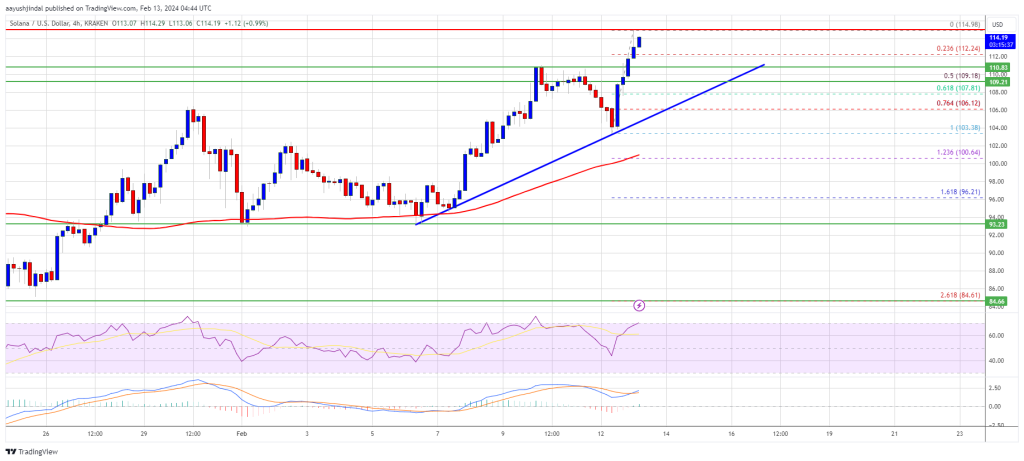 570% up to 12 BTC + 300 Free Spins for new players & 1 BTC in bonuses every day, only at Wild.io. Play Now!
Source: SOLUSD on TradingView.com
Immediate resistance is near the $115 level. The next major resistance is near the $118 level. A successful close above the $118 resistance could set the pace for another major increase. The next key resistance is near $125. Any more gains might send the price toward the $132 level.
Are Dips Supported in SOL?
If SOL fails to rally above the $115 resistance, it could start a downside correction. Initial support on the downside is near the $112.20 level.
The first major support is near the $109.20 level and the trend line, below which the price could test $105. If there is a close below the $105 support, the price could decline toward the $100 support in the near term.
Technical Indicators
4-Hours MACD – The MACD for SOL/USD is gaining pace in the bullish zone.
4-Hours RSI (Relative Strength Index) – The RSI for SOL/USD is above the 50 level.
Major Support Levels – $102.20, and $109.20.
Major Resistance Levels – $115, $118, and $125.
Disclaimer: The article is provided for educational purposes only. It does not represent the opinions of NewsBTC on whether to buy, sell or hold any investments and naturally investing carries risks. You are advised to conduct your own research before making any investment decisions. Use information provided on this website entirely at your own risk.
Ethereum Price Rallies 5%, Why ETH Bulls Could Aim For $3K This Month
Ethereum price is up over 5% and there was a push toward $2,700. ETH is consolidating gains and might aim for a move toward $2,800 or $3,000.
- Ethereum is consolidating gains below the $2,700 resistance zone.
- The price is trading above $2,600 and the 100-hourly Simple Moving Average.
- There was a break above a bullish flag pattern with resistance at $2,500 on the hourly chart of ETH/USD (data feed via Kraken).
- The pair could start a fresh increase if it stays above the $2,630 support zone.
Ethereum Price Starts Fresh Surge
Ethereum price remained stable above the $2,420 resistance. ETH formed a base and started a fresh increase above the $2,500 resistance, outperforming Bitcoin.
There was a break above a bullish flag pattern with resistance at $2,500 on the hourly chart of ETH/USD. The pair gained over 5% and there was a clear move above the $2,600 resistance. It even moved toward the $2,700 level. A high was formed near $2,681 and the price is now consolidating gains.
No KYC Casino and Sportsbook with up to 300% match bonus + 175 Free Spins, and Wager Free Cashback. Play now at ROLR.IO!
There was a minor decline below the $2,660 level. Ethereum is still trading above the 23.6% Fib retracement level of the recent rally from the $2,472 swing low to the $2,681 high. It is also trading above $2,620 and the 100-hourly Simple Moving Average.
If there is a fresh increase, the price could surge above the $2,660 level. On the upside, the first major resistance is near the $2,680 level. The next major resistance is near $2,720, above which the price might rise and test the $2,800 resistance.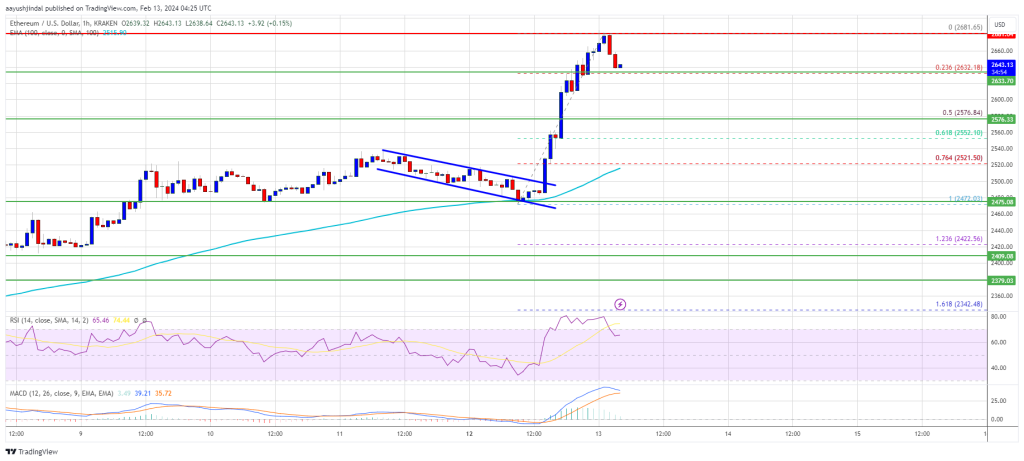 570% up to 12 BTC + 300 Free Spins for new players & 1 BTC in bonuses every day, only at Wild.io. Play Now!
Source: ETHUSD on TradingView.com
If the bulls remain in action, they could even push the price above the $2,800 resistance. In the stated case, the price could rise toward the $3,000 level.
Are Dips Limited In ETH?
If Ethereum fails to clear the $2,680 resistance, it could start a downside correction. Initial support on the downside is near the $2,630 level.
The next key support could be the $2,600 zone. A clear move below the $2,600 support might send the price toward $2,575 or the 50% Fib retracement level of the recent rally from the $2,472 swing low to the $2,681 high. The main support could be $2,520 or the 100 hourly SMA. Any more losses might send the price toward the $2,400 level.
Technical Indicators
Hourly MACD – The MACD for ETH/USD is losing momentum in the bullish zone.
Hourly RSI – The RSI for ETH/USD is now above the 50 level.
Major Support Level – $2,630
Major Resistance Level – $2,680
Disclaimer: The article is provided for educational purposes only. It does not represent the opinions of NewsBTC on whether to buy, sell or hold any investments and naturally investing carries risks. You are advised to conduct your own research before making any investment decisions. Use information provided on this website entirely at your own risk.
Bitcoin Price Revisits $50K, Why BTC Could Start A Short-Term Correction
Bitcoin price extended its rally above the $48,800 resistance. BTC tested $50,000 and is currently showing signs of a downside correction.
- Bitcoin price climbed higher above the $48,500 and $48,800 resistance levels.
- The price is trading above $48,800 and the 100 hourly Simple moving average.
- There is a short-term rising channel forming with support at $49,750 on the hourly chart of the BTC/USD pair (data feed from Kraken).
- The pair could start a downside correction below the $49,750 and $49,500 levels.
Bitcoin Price Jumps 5%
Bitcoin price remained in a positive zone above the $48,000 resistance zone. BTC extended its rally and climbed above the $48,800 resistance zone. Finally, the price jumped above the $50,000 level.
A new multi-week high was formed near $50,339 and the price is now consolidating gains. There was a minor decline below the $50,000 level. The price is still above the 23.6% Fib retracement level of the recent rally from the $47,642 swing low to the $50,339 high.
No KYC Casino and Sportsbook with up to 300% match bonus + 175 Free Spins, and Wager Free Cashback. Play now at ROLR.IO!
Bitcoin price is now trading above $48,800 and the 100 hourly Simple moving average. There is also a short-term rising channel forming with support at $49,750 on the hourly chart of the BTC/USD pair.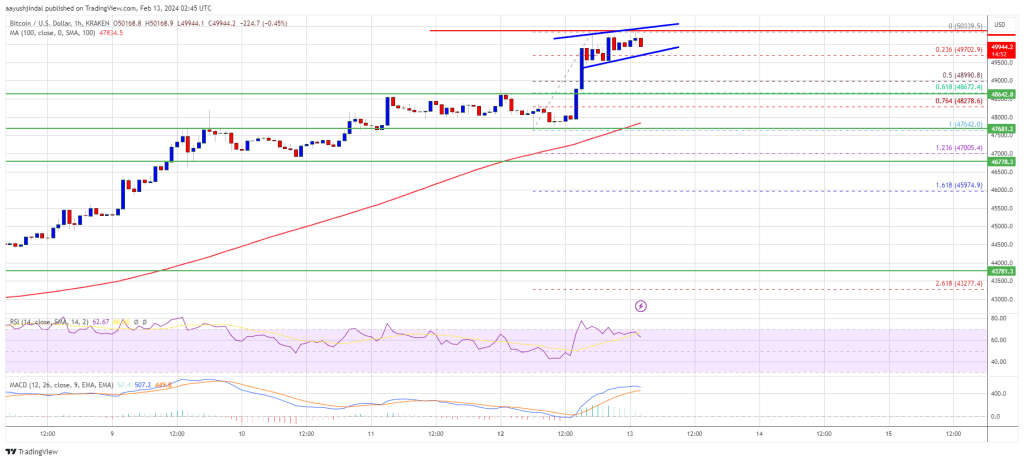 Source: BTCUSD on TradingView.com
570% up to 12 BTC + 300 Free Spins for new players & 1 BTC in bonuses every day, only at Wild.io. Play Now!
Immediate resistance is near the $50,250 level. The next key resistance could be $50,400, above which the price could start another decent increase. The next stop for the bulls may perhaps be $51,200. A clear move above the $51,200 resistance could send the price toward the $52,000 resistance. The next resistance could be near the $53,000 level.
Downside Correction In BTC?
If Bitcoin fails to rise above the $50,250 resistance zone, it could start a downside correction. Immediate support on the downside is near the $49,750 level or the channel trend line.
The first major support is $49,000 and the 50% Fib retracement level of the recent rally from the $47,642 swing low to the $50,339 high. If there is a close below $49,000, the price could gain bearish momentum. In the stated case, the price could dive toward the $47,650 support.
Technical indicators:
Hourly MACD – The MACD is now losing pace in the bullish zone.
Hourly RSI (Relative Strength Index) – The RSI for BTC/USD is now above the 50 level.
Major Support Levels – $49,750, followed by $49,000.
Major Resistance Levels – $50,250, $50,400, and $51,200.
Disclaimer: The article is provided for educational purposes only. It does not represent the opinions of NewsBTC on whether to buy, sell or hold any investments and naturally investing carries risks. You are advised to conduct your own research before making any investment decisions. Use information provided on this website entirely at your own risk.