Bitcoin cash (BCH) markets have been declining in value following suit with BTC and a vast majority

Bitcoin cash (BCH) markets have been declining in value following suit with BTC and a vast majority of cryptocurrency prices suffering from losses the past five days. The price has since stabilized hovering around the $1,075 range after touching a low of $920 per coin just a few days ago.
Also read: Ant Creek: Is Bitmain Quietly Developing a Mining Facility in the US?

Bitcoin Cash Prices Stabilize After a Bearish Week
BCH/USD markets have seen some lows lately but so has nearly every crypto in the entire digital asset economy. BCH charts show a strong correlation with BTC/USD values as both markets consistently share the same amount of percentage gains and losses. For every $1,000 U.S. dollars BTC loses, BCH values roughly drops by $100, and BCH usually commands about 10-12 percent of BTC’s aggregated value. Once in a while there are some stronger differences between markets depending on community sentiment or a new announcement for one or the other.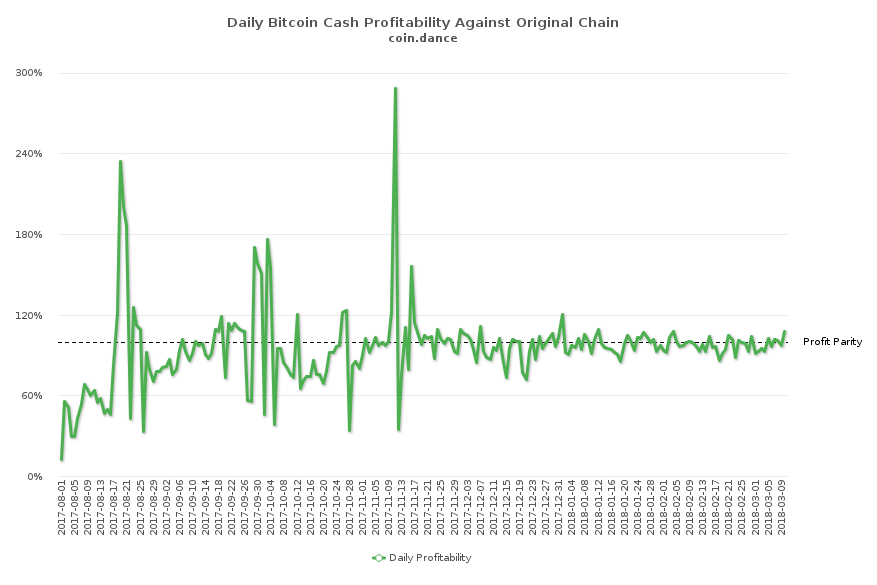 BCH mining profit parity against the BTC chain. Profitability has been consistent since this past November’s DAA hard fork.
At the time of publication, the BCH chain is operating at 10.55 percent of the BTC chain’s difficulty. This means today it is 6.1 percent more profitable to mine BCH than BTC, but profitability has been consistently between 5 percent lower or higher since the November BCH hard fork last year. The past 24-hours of trading sessions show BCH markets are up over 8 percent and command roughly $430Mn in daily trade volume. The top five exchanges swapping the most BCH on March 10 includes Okex, Hitbtc, Lbank, Huobi, and Bitfinex. With one BCH worth 0.1133 BTC most of the trade volume today is for bitcoin core to bitcoin cash swaps by 48 percent. Tether (USDT) follows right behind BTC/BCH swaps at 23.7 percent during today’s trading sessions. This is followed by the Korean won (5.6%), ethereum (1.6%), and the euro (1%).
Technical Indicators
Charts show the bearish decline is starting to reverse a hair like the rest of the crypto-markets, but traders are unsure of whether or not it’s just a ‘dead cat bounce.’ BCH volume has been decent, but like BTC volumes they are far lower than a few months ago, so overall cryptocurrency interest has waned across the board. The two Simple Moving Averages (100-200 SMA) have a large spread at the moment on the 4-hour chart. The long-term 200 SMA is well above the 100 SMA trendline, indicating the path upwards will be tough for bulls. During our last update bitcoin cash, RSI and Stochastic oscillators were showing ‘oversold’ conditions, but these indicators are improving this weekend.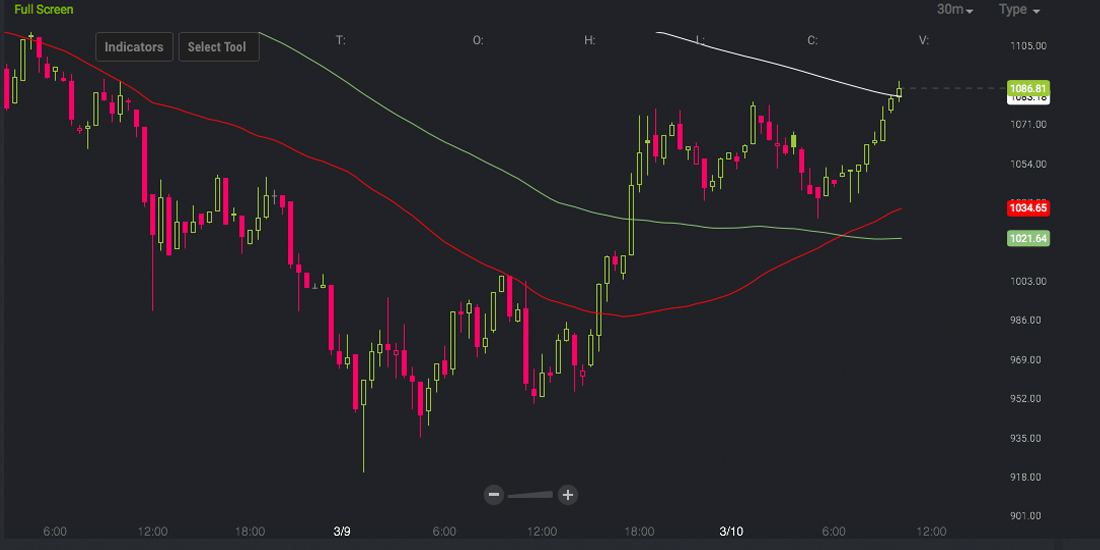 Today’s trading sessions show BCH/USD’s market value is around $1,086 at the time of publication.
Just like BTC, the markets show very tight Bollinger Bands and both cryptocurrencies are forming a wedge formation. BCH/USD order books show some strong resistance up until the $1150 range with some smoother seas beyond that region. There will be another pit stop around the $1225 zone, but it may not be as bad as the walls past the $1100 territory. On the back side, BCH has shown some solid foundations and support. There is a massive buy wall that should hold up until $950; if that Displaced Moving Average breaks lower, values between the $750-850 region is not out of the question. Essentially this means for all crypto-markets the bear market sentiment may not be over just yet.
Bitcoin cash (BCH) markets have been declining in value following suit with BTC and a vast majority of cryptocurrency prices suffering from losses the past five days. The price has since stabilized hovering around the $1,075 range after touching a low of $920 per coin just a few days ago.
Also read: Ant Creek: Is Bitmain Quietly Developing a Mining Facility in the US?
Bitcoin Cash Prices Stabilize After a Bearish Week
BCH/USD markets have seen some lows lately but so has nearly every crypto in the entire digital asset economy. BCH charts show a strong correlation with BTC/USD values as both markets consistently share the same amount of percentage gains and losses. For every $1,000 U.S. dollars BTC loses, BCH values roughly drops by $100, and BCH usually commands about 10-12 percent of BTC’s aggregated value. Once in a while there are some stronger differences between markets depending on community sentiment or a new announcement for one or the other.BCH mining profit parity against the BTC chain. Profitability has been consistent since this past November’s DAA hard fork.
At the time of publication, the BCH chain is operating at 10.55 percent of the BTC chain’s difficulty. This means today it is 6.1 percent more profitable to mine BCH than BTC, but profitability has been consistently between 5 percent lower or higher since the November BCH hard fork last year. The past 24-hours of trading sessions show BCH markets are up over 8 percent and command roughly $430Mn in daily trade volume. The top five exchanges swapping the most BCH on March 10 includes Okex, Hitbtc, Lbank, Huobi, and Bitfinex. With one BCH worth 0.1133 BTC most of the trade volume today is for bitcoin core to bitcoin cash swaps by 48 percent. Tether (USDT) follows right behind BTC/BCH swaps at 23.7 percent during today’s trading sessions. This is followed by the Korean won (5.6%), ethereum (1.6%), and the euro (1%).
Technical Indicators
Charts show the bearish decline is starting to reverse a hair like the rest of the crypto-markets, but traders are unsure of whether or not it’s just a ‘dead cat bounce.’ BCH volume has been decent, but like BTC volumes they are far lower than a few months ago, so overall cryptocurrency interest has waned across the board. The two Simple Moving Averages (100-200 SMA) have a large spread at the moment on the 4-hour chart. The long-term 200 SMA is well above the 100 SMA trendline, indicating the path upwards will be tough for bulls. During our last update bitcoin cash, RSI and Stochastic oscillators were showing ‘oversold’ conditions, but these indicators are improving this weekend.Today’s trading sessions show BCH/USD’s market value is around $1,086 at the time of publication.
Just like BTC, the markets show very tight Bollinger Bands and both cryptocurrencies are forming a wedge formation. BCH/USD order books show some strong resistance up until the $1150 range with some smoother seas beyond that region. There will be another pit stop around the $1225 zone, but it may not be as bad as the walls past the $1100 territory. On the back side, BCH has shown some solid foundations and support. There is a massive buy wall that should hold up until $950; if that Displaced Moving Average breaks lower, values between the $750-850 region is not out of the question. Essentially this means for all crypto-markets the bear market sentiment may not be over just yet.
Bitcoin cash (BCH) markets have been declining in value following suit with BTC and a vast majority of cryptocurrency prices suffering from losses the past five days. The price has since stabilized hovering around the $1,075 range after touching a low of $920 per coin just a few days ago.
Also read: Ant Creek: Is Bitmain Quietly Developing a Mining Facility in the US?
Bitcoin Cash Prices Stabilize After a Bearish Week
BCH/USD markets have seen some lows lately but so has nearly every crypto in the entire digital asset economy. BCH charts show a strong correlation with BTC/USD values as both markets consistently share the same amount of percentage gains and losses. For every $1,000 U.S. dollars BTC loses, BCH values roughly drops by $100, and BCH usually commands about 10-12 percent of BTC’s aggregated value. Once in a while there are some stronger differences between markets depending on community sentiment or a new announcement for one or the other.BCH mining profit parity against the BTC chain. Profitability has been consistent since this past November’s DAA hard fork.
At the time of publication, the BCH chain is operating at 10.55 percent of the BTC chain’s difficulty. This means today it is 6.1 percent more profitable to mine BCH than BTC, but profitability has been consistently between 5 percent lower or higher since the November BCH hard fork last year. The past 24-hours of trading sessions show BCH markets are up over 8 percent and command roughly $430Mn in daily trade volume. The top five exchanges swapping the most BCH on March 10 includes Okex, Hitbtc, Lbank, Huobi, and Bitfinex. With one BCH worth 0.1133 BTC most of the trade volume today is for bitcoin core to bitcoin cash swaps by 48 percent. Tether (USDT) follows right consistently between 5 percent lower or higher since the November BCH hard fork last year. The past 24-hours of trading sessions show BCH markets are up over 8 percent and command roughly $430Mn in daily trade volume. The top five exchanges swapping the most BCH on March 10 includes Okex, Hitbtc, Lbank, Huobi, and Bitfinex. With one BCH worth 0.1133 BTC most of the trade volume today is for bitcoin core to bitcoin cash swaps by 48 percent. Tether (USDT) follows right behind BTC/BCH swaps at 23.7 percent during today’s trading sessions. This is followed by the Korean won (5.6%), ethereum (1.6%), and the euro (1%).
Technical Indicators
Charts show the bearish decline is starting to reverse a hair like the rest of the crypto-markets, but traders are unsure of whether or not it’s just a ‘dead cat bounce.’ BCH volume has been decent, but like BTC volumes they are far lower than a few months ago, so overall cryptocurrency interest has waned across the board. The two Simple Moving Averages (100-200 SMA) have a large spread at the moment on the 4-hour chart. The long-term 200 SMA is well above the 100 SMA trendline, indicating the path upwards will be tough for bulls. During our last update bitcoin cash, RSI and Stochastic oscillators were showing ‘oversold’ conditions, but these indicators are improving this weekend.Today’s trading sessions show BCH/USD’s market value is around $1,086 at the time of publication.
Just like BTC, the markets show very tight Bollinger Bands and both cryptocurrencies are forming a wedge formation. BCH/USD order books show some strong resistance up until the $1150 range with some smoother seas beyond that region. There will be another pit stop around the $1225 zone, but it may not be as bad as the walls past the $1100 territory. On the back side, BCH has shown some solid foundations and support. There is a massive buy wall that should hold up until $950; if that Displaced Moving Average breaks lower, values between the $750-850 region is not out of the question. Essentially this means for all crypto-markets the bear market sentiment may not be over just yet.
Bitcoin cash (BCH) markets have been declining in value following suit with BTC and a vast majority of cryptocurrency prices suffering from losses the past five days. The price has since stabilized hovering around the $1,075 range after touching a low of $920 per coin just a few days ago.
Also read: Ant Creek: Is Bitmain Quietly Developing a Mining Facility in the US?
Bitcoin Cash Prices Stabilize After a Bearish Week
BCH/USD markets have seen some lows lately but so has nearly every crypto in the entire digital asset economy. BCH charts show a strong correlation with BTC/USD values as both markets consistently share the same amount of percentage gains and losses. For every $1,000 U.S. dollars BTC loses, BCH values roughly drops by $100, and BCH usually commands about 10-12 percent of BTC’s aggregated value. Once in a while there are some stronger differences between markets depending on community sentiment or a new announcement for one or the other.BCH mining profit parity against the BTC chain. Profitability has been consistent since this past November’s DAA hard fork.
At the time of publication, the BCH chain is operating at 10.55 percent of the BTC chain’s difficulty. This means today it is 6.1 percent more profitable to mine BCH than BTC, but profitability has been consistently between 5 percent lower or higher since the November BCH hard fork last year. The past 24-hours of trading sessions show BCH markets are up over 8 percent and command roughly $430Mn in daily trade volume. The top five exchanges swapping the most BCH on March 10 includes Okex, Hitbtc, Lbank, Huobi, and Bitfinex. With one BCH worth 0.1133 BTC most of the trade volume today is for bitcoin core to bitcoin cash swaps by 48 percent. Tether (USDT) follows right behind BTC/BCH swaps at 23.7 percent during today’s trading sessions. This is followed by the Korean won (5.6%), ethereum (1.6%), and the euro (1%).
Technical Indicators
Charts show the bearish decline is starting to reverse a hair like the rest of the crypto-markets, but traders are unsure of whether or not it’s just a ‘dead cat bounce.’ BCH volume has been decent, but like BTC volumes they are far lower than a few months ago, so overall cryptocurrency interest has waned across the board. The two Simple Moving Averages (100-200 SMA) have a large spread at the moment on the 4-hour chart. The long-term 200 SMA is well above the 100 SMA trendline, indicating the path upwards will be tough for bulls. During our last update bitcoin cash, RSI and Stochastic oscillators were showing ‘oversold’ conditions, but these indicators are improving this weekend.Today’s trading sessions show BCH/USD’s market value is around $1,086 at the time of publication.
Just like BTC, the markets show very tight Bollinger Bands and both cryptocurrencies are forming a wedge formation. BCH/USD order books show some strong resistance up until the $1150 range with some smoother seas beyond that region. There will be another pit stop around the $1225 zone, but it may not be as bad as the walls past the $1100 territory. On the back side, BCH has shown some solid foundations and support. There is a massive buy wall that should hold up until $950; if that Displaced Moving Average breaks lower, values between the $750-850 region is not out of the question. Essentially this means for all crypto-markets the bear market sentiment may not be over just yet.
Bitcoin cash (BCH) markets have been declining in value following suit with BTC and a vast majority of cryptocurrency prices suffering from losses the past five days. The price has since stabilized hovering around the $1,075 range after touching a low of $920 per coin just a few days ago.
Also read: Ant Creek: Is Bitmain Quietly Developing a Mining Facility in the US?
Bitcoin Cash Prices Stabilize After a Bearish Week
BCH/USD markets have seen some lows lately but so has nearly every crypto in the entire digital asset economy. BCH charts show a strong correlation with BTC/USD values as both markets consistently share the same amount of percentage gains and losses. For every $1,000 U.S. dollars BTC loses, BCH values roughly drops by $100, and BCH usually commands about 10-12 percent of BTC’s aggregated value. Once in a while there are some stronger differences between markets depending on community sentiment or a new announcement for one or the other.BCH mining profit parity against the BTC chain. Profitability has been consistent since this past November’s DAA hard fork.
At the time of publication, the BCH chain is operating at 10.55 percent of the BTC chain’s difficulty. This means today it is 6.1 percent more profitable to mine BCH than BTC, but profitability has been consistently between 5 percent lower or higher since the November BCH hard fork last year. The past 24-hours of trading sessions show BCH markets are up over 8 percent and command roughly $430Mn in daily trade volume. The top five exchanges swapping the most BCH on March 10 includes Okex, Hitbtc, Lbank, Huobi, and Bitfinex. With one BCH worth 0.1133 BTC most of the trade volume today is for bitcoin core to bitcoin cash swaps by 48 percent. Tether (USDT) follows right behind BTC/BCH swaps at 23.7 percent during today’s trading sessions. This is followed by the Korean won (5.6%), ethereum (1.6%), and the euro (1%).
Technical Indicators
Charts show the bearish decline is starting to reverse a hair like the rest of the crypto-markets, but traders are unsure of whether or not it’s just a ‘dead cat bounce.’ BCH volume has been decent, but like BTC volumes they are far lower than a few months ago, so overall cryptocurrency interest has waned across the board. The two Simple Moving Averages (100-200 SMA) have a large spread at the moment on the 4-hour chart. The long-term 200 SMA is well above the 100 SMA trendline, indicating the path upwards will be tough for bulls. During our last update bitcoin cash, RSI and Stochastic oscillators were showing ‘oversold’ conditions, but these indicators are improving this weekend.Today’s trading sessions show BCH/USD’s market value is around $1,086 at the time of publication.
Just like BTC, the markets show very tight Bollinger Bands and both cryptocurrencies are forming a wedge formation. BCH/USD order books show some strong resistance up until the $1150 range with some smoother seas beyond that region. There will be another pit stop around the $1225 zone, but it may not be as bad as the walls past the $1100 territory. On the back side, BCH has shown some solid foundations and support. There is a massive buy wall that should hold up until $950; if that Displaced Moving Average breaks lower, values between the $750-850 region is not out of the question. Essentially this means for all crypto-markets the bear market sentiment may not be over just yet.


