how to know strength of trend (part1)

8 INDICATORS, TIPS AND TOOLS TO READ TREND STRENGTH IN TRADING
Trading is all about being able to read market structure, sentiment and the balance between bulls and bears. Understanding if a trend is gaining or losing momentum is important if you are trying to make decisions about whether support and resistance levels are likely to hold or break, if a trend will continue, or if a reversal can be expected anytime soon.
In a different article, we talked about how to understand the direction of a trend; this article explains how to read the trend strength from your charts. The following 6 concepts, tools and indicators can help you make sense of price action and provide insights about market structure.
1) PRICE ACTION ANALYSIS
TREND WAVES – LENGTH, STEEPNESS, AND SMOOTHNESS
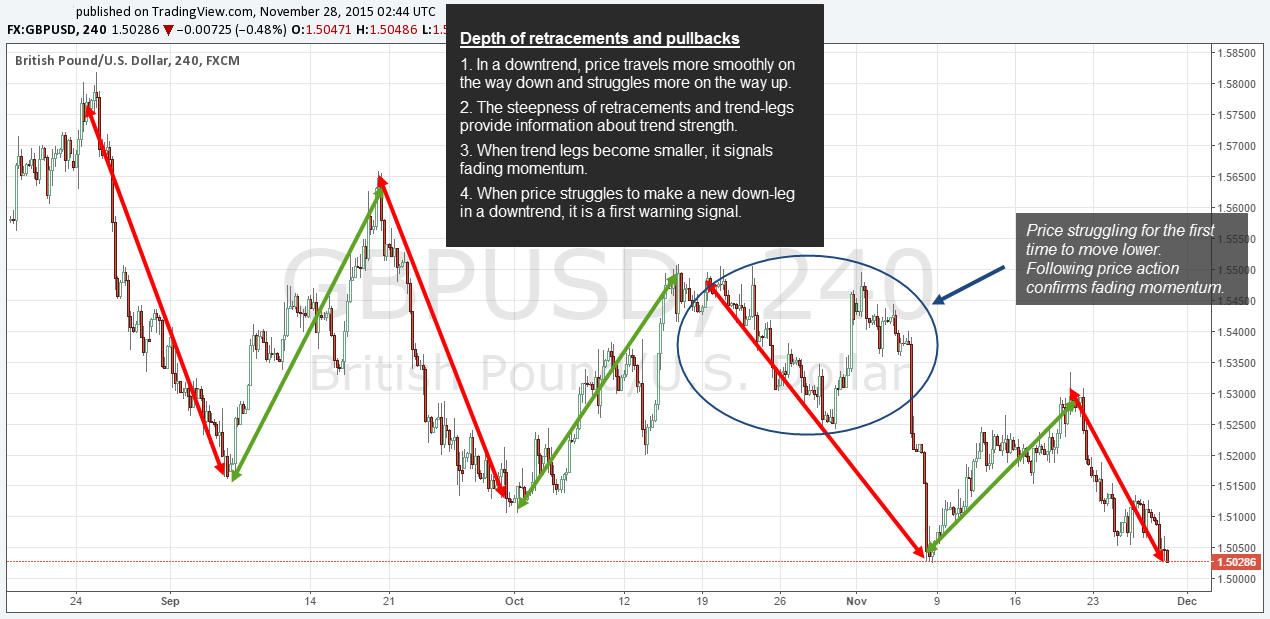
The first point lays the groundwork for all that follows and it describes the basics of price movement. The way price moves during trending waves and pullbacks can tell you a lot. The chart below shows a downtrend with a series of lower lows. At the same time, you can see that the bearish price waves are much smoother and the bullish pullbacks are less smooth.
Secondly, the steepness of the bearish price waves decreases and they become shallower as the trend continues. Steep price waves indicate trend strength whereas shallow price waves signal a lack of strength. Also, the size of the trend-waves is important to understand. The chart below shows that the bearish trend-waves become smaller.
The blue circled area highlights the first period bears faced strong opposition and price wasn’t able to move further down as smooth. This price behavior is in sharp contrast to previous price action. In a strong and healthy downtrend, the bearish trend-waves do occur mainly uninterrupted.
PULLBACKS DURING A TREND
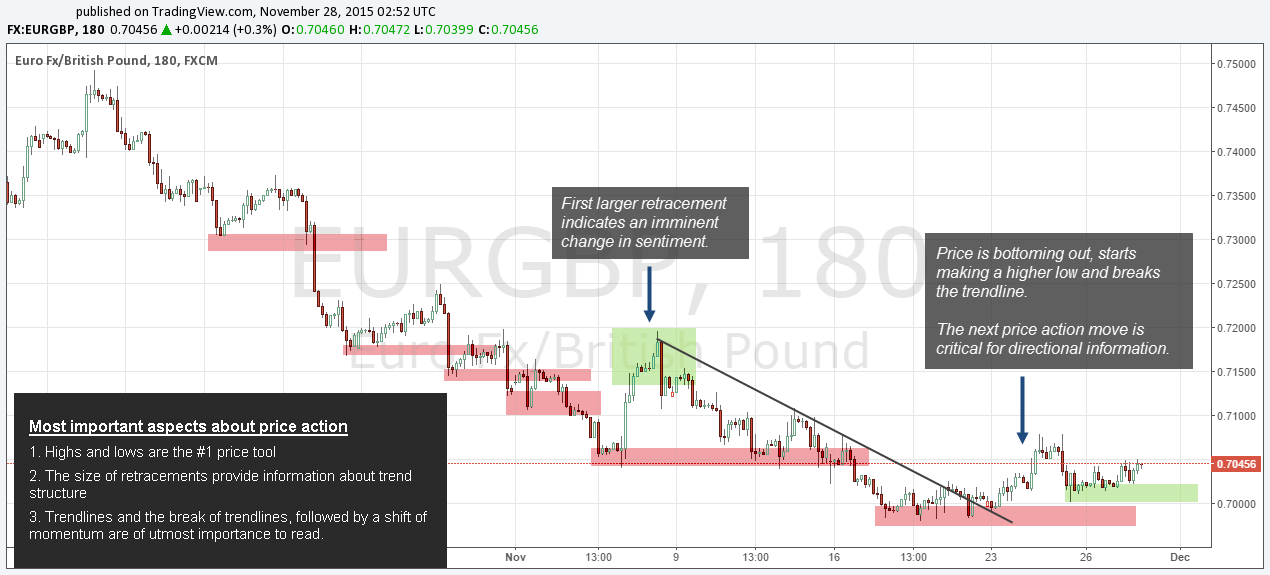
The next screenshot highlights the importance of putting the size of pullbacks into context:
- The first green shaded area shows the first larger pullback during the ongoing downtrend.
- Before that, the pullbacks were relatively small which signaled strong momentum to the downside. Often, strong trends only show sideways ranges instead of real pullbacks.
- A large pullback can foreshadow a broken market structure and it provides first indications of losing trend strength.
- Finally, price failed to make lower lows altogether which had been foreshadowed by the increasing size of pullbacks against the downtrend.
2) THE SLOPE OF TRENDLINES
Trendlines are a great trading tool because they provide instant information about the strength of a trend. First, you have to pay attention to the angle of a trendline because the angle shows you exactly how strong the trend is. In an uptrend, a small angle means that the new lows are not moving up as fast. However, once the angle becomes too large, it often signals a trend (Boom) which is not sustainable.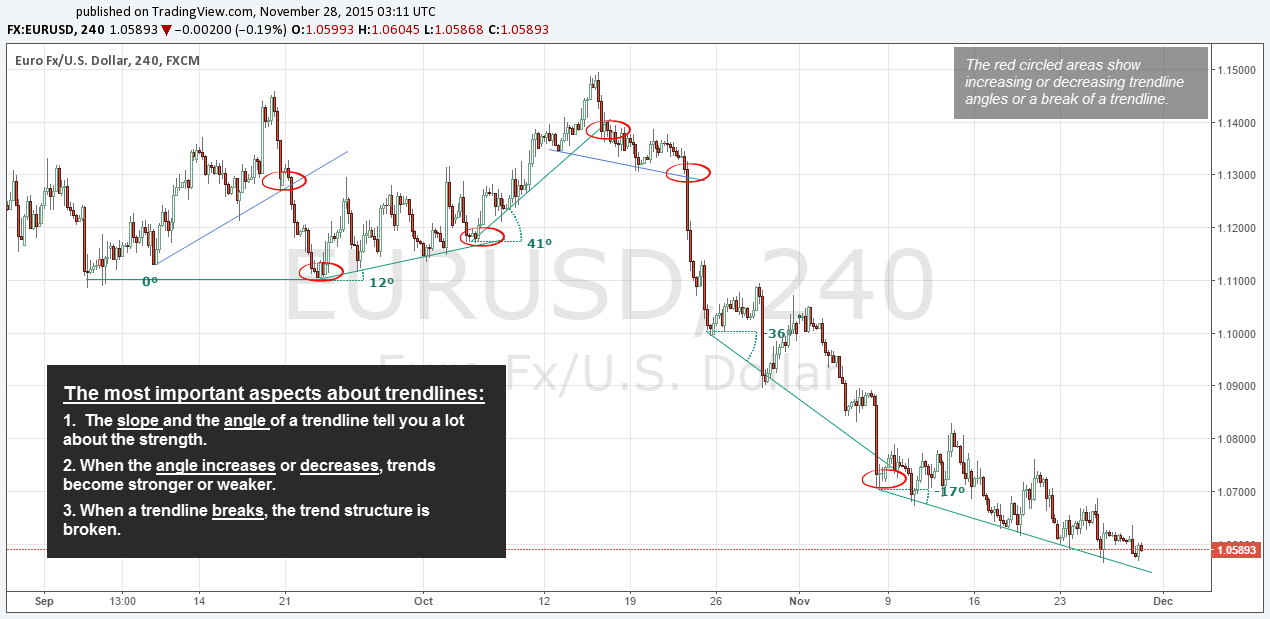
An increase in the angle of trendlines means that price is gaining momentum and price is making higher highs faster. Finally, a break of a trendline signals a broken market structure. A break can either mean a decrease in the momentum of a trend or a complete trend reversal.
- The slope of trendlines describe trend strength
- An increasing slope in an uptrend shows a trend with rising momentum
- A decreasing slope shows fading momentum
- The break of a trendline is the final signal of a trend reversal