SOL Price Challenges 78.60% Fib Level, Eyes $250 Next Week!

 Story Highlights
- With a rounding bottom pattern and a long-tail candle, the current recovery trend in Solana price gains momentum.
- The uptrend challenges the overhead 78.60% Fibonacci level coinciding with the psycholgical mark of $200.
- A potential breakout above the psychological mark of $200 could ignite a run to $250 next week.
As the overall market recovery picks up pace with the 10% surge in Bitcoin last night, the Solana price trend is back on bullish track. With an intraday jump of 13.05%, the SOL price is in attempts to undermine the 13.37% drop a day before the jump.
Currently, the altcoin is heading closer to the psychological mark of $200 and is preparing for a breakout. Further, with the high anticipations of Bitcoin price reclaiming the $73,000 valuation, our SOL price prediction expects a breakou rally.
Will Solana Surpass $200?
In the weekly chart, the bullish reversal in the long-term Solana trend sustains the uphill journey. This keeps the anticipations on a higher note amongst the sideline traders for a bull run crossing the $200 mark.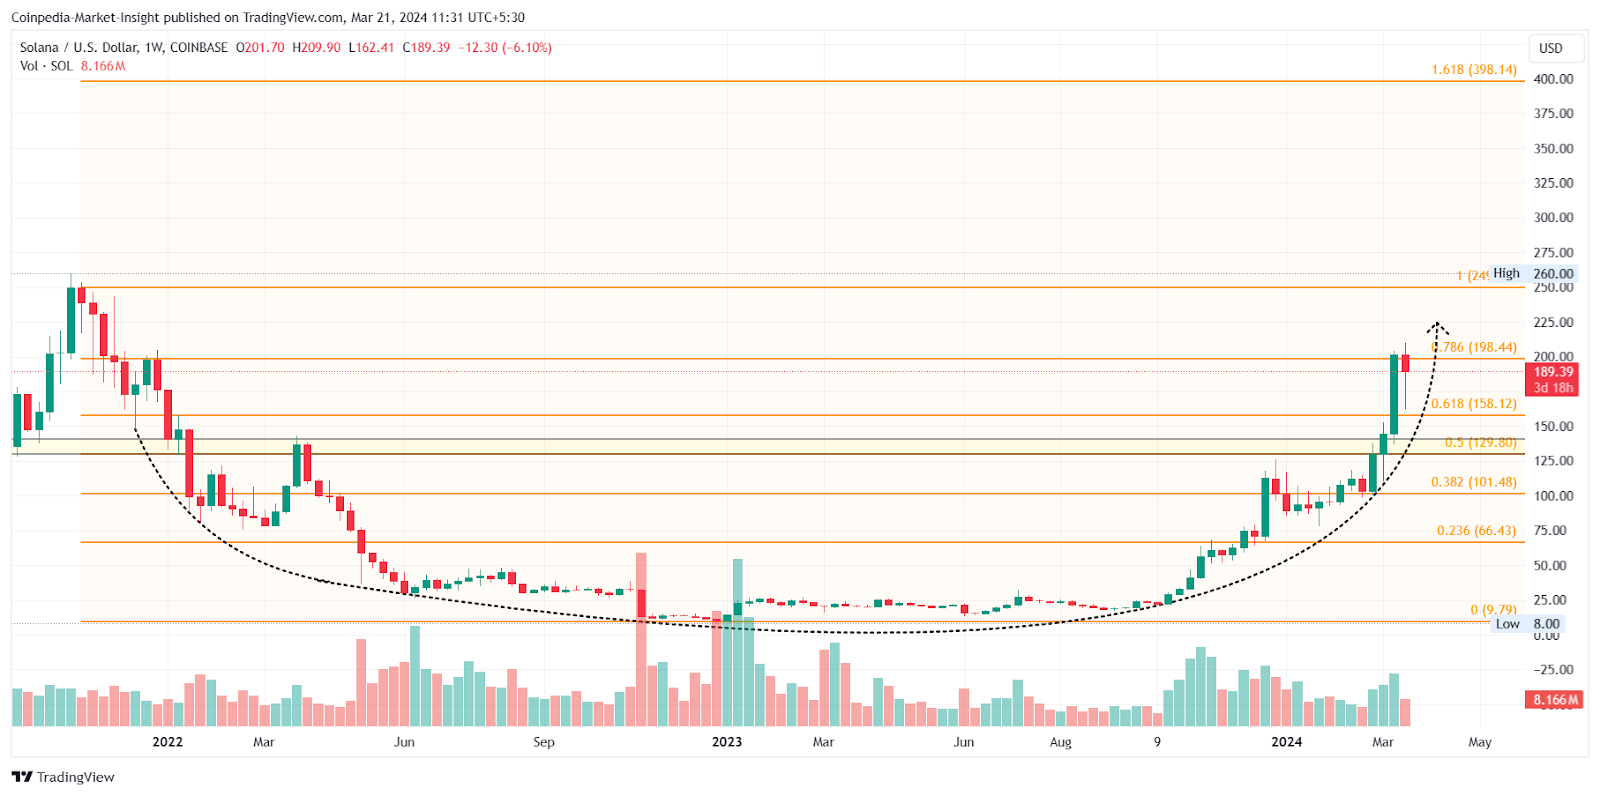
With a visible long tail in the ongoing weekly candle, SOL price is reflecting a large deposit of underlying demand. Hence, with the recent release of trapped momentum coupled with the market’s upside move, the altcoin can easily make a new 52-W high.
Currently, Solana’s native token exchanges hands at $190.47 with a small pause of 0.70% in the intraday candle. Nevertheless, the surge in trading volume bolstering the 13% overnight jump teases a trend continuation.
Technical Indicators:
MACD Indicator: With a significant lower price rejection, the buyers sustain a positive flow in the MACD and signal lines. Thus, the momentum indicator projects a high likelihood of uptrend continuation in Solana.
Will SOL Price Hit $250?
As per the ongoing reversal rally and the Fibonacci retracement in the weekly chart, the buyers are dominating the Solana price trend. With the SOL price ready to cross the 78.60% Fib level and the psychological mark of $200, the buyers are aiming for higher levels. The 883% jump in the last 175 days cements the breakout likelihood.
Considering the uptrend surpass the crucial resistance confluence, the Solana market value can peak at $260 by the end of this month.
Price Analysis Solana (SOL)
Crypto Market Surges: GRT Price Explodes 56%, CRO Poised for Breakout
Story Highlights
- The total crypto market cap jumped 10% to $2.65 trillion, with Bitcoin rising 7.6% and Ethereum 10%.
- The US Fed holding interest rates steady, with potential cuts later in 2024, is seen as positive for crypto investment.
- The Graph (GRT) and Cronos (CRO) are highlighted as promising altcoins with potential for significant price increases.
In the wake of recent heavy losses, the cryptocurrency market, spearheaded by Bitcoin (BTC) and Ethereum (ETH), is poised for a significant rally in the near future. Over the past 24 hours leading up to Thursday’s early London session, the total cryptocurrency market cap surged by 10 percent to approximately $2.65 trillion. Bitcoin surged by about 7.6 percent, reclaiming the $67k mark and triggering over $318 million in crypto liquidations.
Cause for Crypto Rebound
A look into the Fed’s decision
On Wednesday, the United States Federal Reserve made a pivotal decision to maintain its benchmark interest rate between 5.50 percent and 5.25 percent. Despite ongoing concerns about US dollar inflation, economists are forecasting three interest rate cuts during the latter half of this year.
Japan’s monetary policy shift
The recent notable shift in monetary policy by the Bank of Japan is expected to have a significant impact on the cryptocurrency market, with investors turning towards quality investments.
Altcoins pick pace
As Bitcoin gears up to reclaim its all-time high, the altcoin market is poised to follow suit, presenting promising opportunities. Particularly, layer one (L1) projects and leading DeFi-based tokens are drawing attention as potential investment targets.
Also Read: Reddit Altcoins to Surge 500% Ahead of an Oversubscribed IPO!
The Graph (GRT)
The Graph (GRT), a distinguished proof-of-stake data infrastructure within the web3 ecosystem, has garnered attention from top-tier investors, including Coinbase Ventures. With a daily traded volume of approximately $226 million, GRT has surged by more than 56 percent in the past four weeks, reaching around 39 cents on Thursday.
Technical Analysis and Growth
From a technical perspective, GRT’s price against the USD is poised to rally towards $1.2 in the near future, following the conclusion of its ongoing correction. Additionally, the weekly Relative Strength Index (RSI) has surpassed the 70 level, indicating bullish momentum. The Elliott wave theory suggests a forthcoming bullish wave for GRT, driven by positive fundamental factors.
Cronos (CRO)
Cronos (CRO), an exchange-based altcoin compatible with the Ethereum ecosystem, is experiencing the initial stages of its second bull run. Having broken out of a descending trend earlier this year, CRO’s price has exhibited higher highs and higher lows, indicative of an upward trend.
With a midterm target set around 50 cents, CRO is poised to overcome resistance around 18 cents in the near future, presenting compelling opportunities for investors.
Read More: Major Altcoins to Rally 2x Before May
Altcoins Price Analysis
Altcoins Regain Momentum As RUNE And STX Price Surge! What’s Next?
 After displaying a negative trend for three consecutive days, the crypto market has recorded a massive bounce back in valuation with top altcoins experiencing a significant bullish reversal in the chart.
With the Altcoins leader, Ethereum, has recorded a jump of over 10% in value, top tokens have followed in the footsteps and displayed a similar trend in their respective charts.
THORChain (RUNE) Price Analysis:
The RUNE price traded in a closed range between $4.897 and $6.252 for a brief period, during which the altcoin made multiple attempts to break out of the resistance level. As the market volatility grew, the THORChain token added 55.25% within two days, following which the price traded sideways.
After this, the bulls jumped 55.58% over the next four days, following which the price displayed a sideways trend for a period. The token was then trading under a bearish influence for a while. After testing its low of $7.087, the bulls recently regained momentum and displayed a bullish move.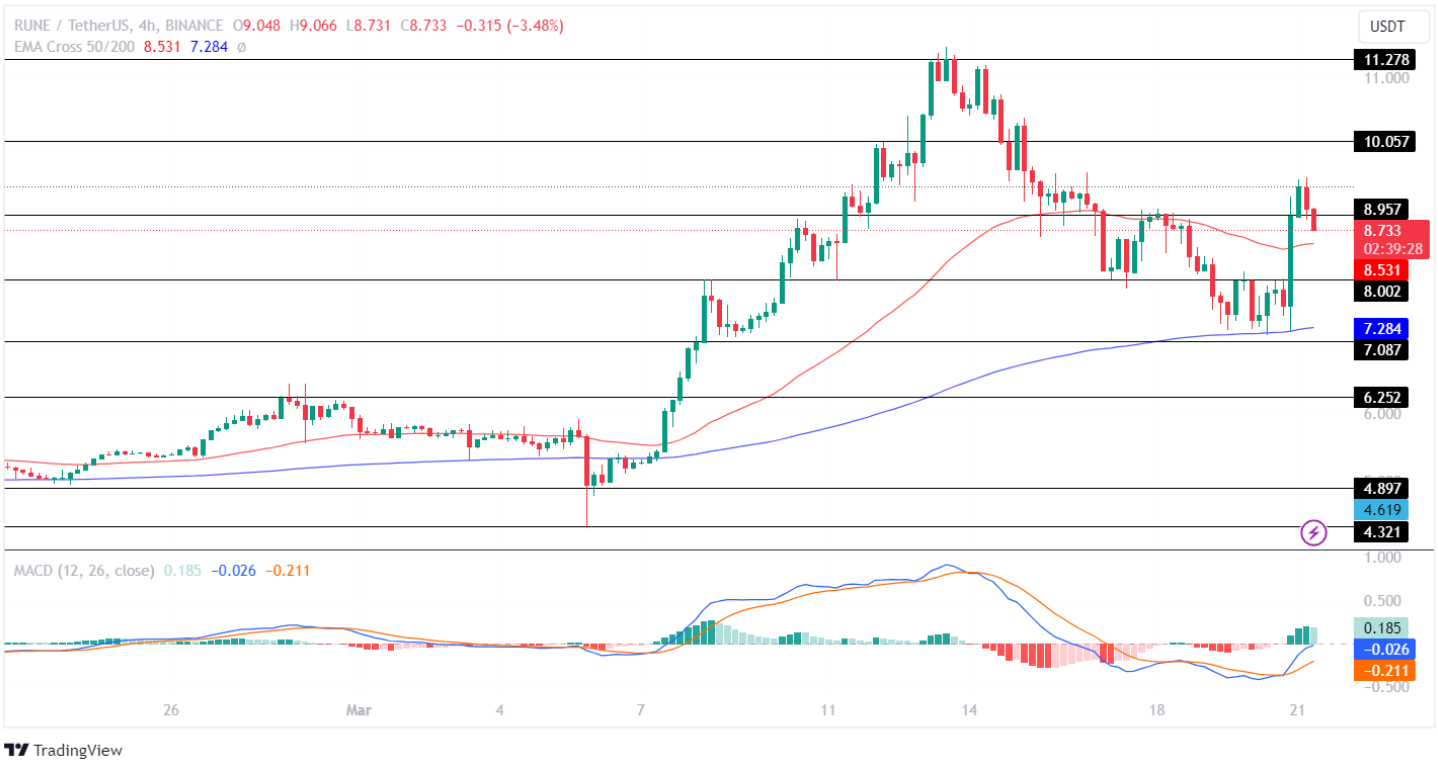
The Moving Average Convergence Divergence (MACD) displays a rising green histogram, indicating an increase in the buying pressure within the crypto space. On the other hand, the averages show a significant rise in the chart, suggesting the price will continue gaining value in the coming time.
If the market holds the price above the resistance level of $8.957, the bulls will regain momentum and prepare to test its upper resistance level of $10.057. Further, if the bulls hold the price at that level, the Stacks token will prepare to test its resistance level of $11.278 over the coming weekend.
Also Read : Crypto Market Surges: GRT Price Explodes 56%, CRO Poised for Breakout
Stacks (STX) Price Analysis:
The STX price displayed a neutral trend for a while, following which the bulls regained momentum and recorded a jump of approximately 31%. The Stacks token then traded in a closed range between $2.817 and $3.121 for a brief period, during which the altcoin displayed significant fluctuation.
Following this, the bulls lost momentum, resulting in the Stacks price testing its low of $2.617. After trading sideways for a while, the bulls regained momentum and recorded a jump of 26.77% before facing rejection at the resistance level of $3.40.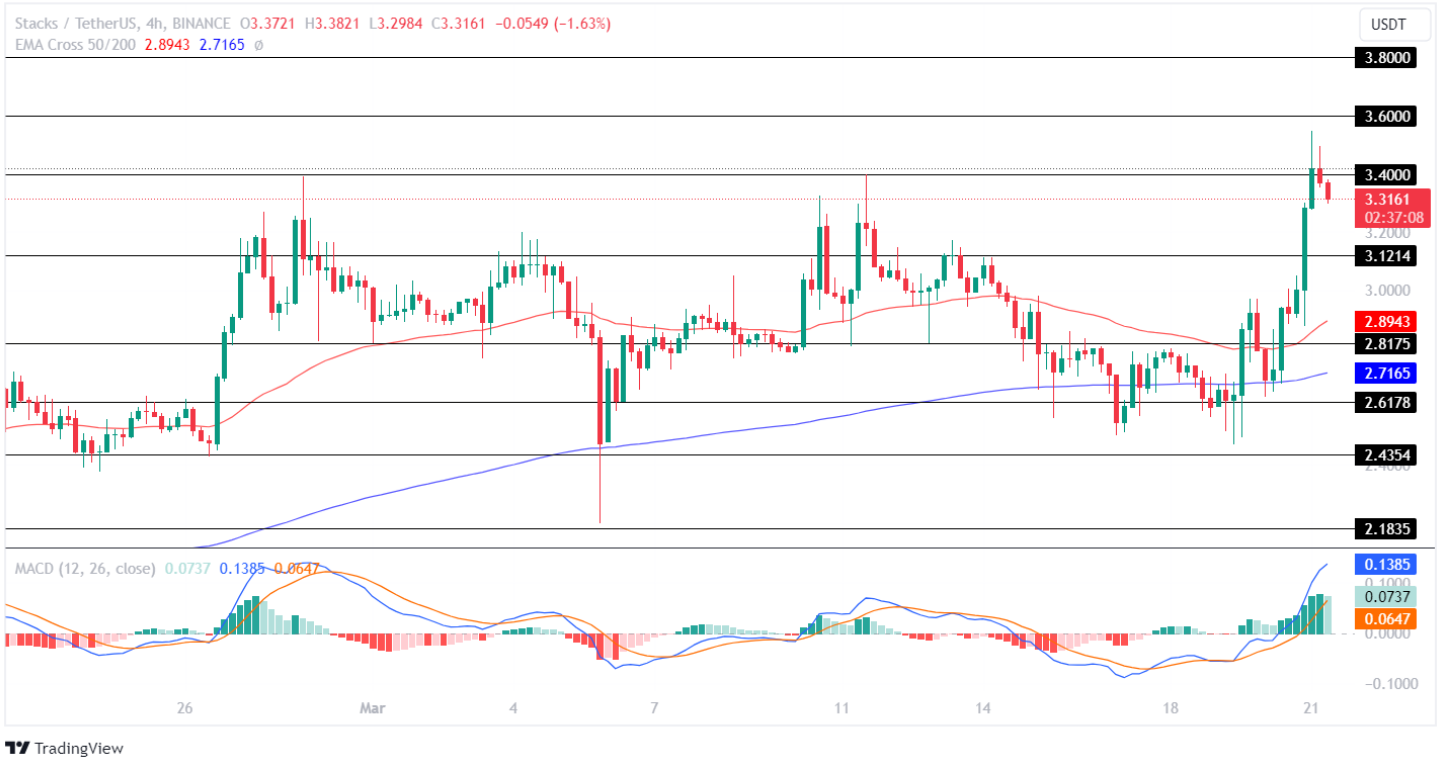
The technical indicator, MACD, shows a constant green histogram, highlighting a robust bullish sentiment in the cryptocurrency market. Further, the averages display a rising pattern, indicating a positive price action for the STX price in the coming time.
If bulls regain power and push the price above the resistance level of $3.40, the Stacks price will prepare to test its upper resistance level of $3.80 over the upcoming weekend. Negatively, a bearish trend reversal may pull the price toward its low of $2.817 this month.
Altcoins Price Analysis
Meme Coin Rally Strikes Again: DOGE, PEPE, SHIB FLOKI Eye 100% Spike
 With a positive Wednesday, the crypto market shines bright, reflecting the underlying demand resurfacing and concluding minor pullbacks. Further, with almost 10% in Bitcoin, the meme coins are back in action as the optimism and hype around the bull market drive them.
Amidst the rising momentum, the DOGE, SHIB and PEPE are top performers with the most credibility in the meme coin market. Moreover, with the astonishing surge in these coins last night, the dynamics are changing to favor the next bull run.
So, are you prepared to ride the next surge in the meme coins sector?
Biggest Meme Coin DOGE Ignites Breakout Run
With the biggest market cap in the meme coin sector, the 9th biggest cryptocurrency in the industry finds a strong bullish footing. Following the days of correction from the peak of $0.190 to test the 38.20% Fib level at $0.1269, the DOGE price is heading back to higher levels.  TradingView
In the 4H chart, the DOGE price shows a falling channel, failing to sustain the downtrend as the buyers come back. With a bullish breakout, the Dogecoin price is challenging the 61.80% Fib level and teases a bull run beyond it.
Considering the uptrend sustained following the 18% surge last night, the DOGE price could easily hit the $0.20 mark this month. In the longer term, the bull run has the potential to scale out the 2.618 Fib level at $0.32, accounting for a more than 100% jump.
Shiba Inu Double Bottom Reversal Creates Hype
Being one of the top choices in the meme coin sector, Shiba Inu is always in the news with a buzz around it. Following the remarkable jump of 360% in late Feb and early March, the exhaustion in buyers led to a pullback phase.  TradingView
With almost a 45% correction, the SHIB price drops to the $0.00002451 mark from the peak of $0.00004567, leading to a declining channel. Further, the meme coin forms a bullish flag pattern with the prevailing uptrend.
As the recent rise in the meme coin’s demand aligns with a double bottom pattern forming at $0.000024, the market price skyrockets. This surge leads to a bullish breakout to surpass the overhead trendline.
As the SHIB price retests the broken trendline, the sideline traders anticipate the uptrend to test the supply pressure at $0.000040 before scaling to $0.000058.
Frog-themed Meme Coin PEPE Shines The Brightest
The PEPE price shows a massive bull run in the top-tier levels of top performers in the 4H chart. With more than an 800% surge from February 16th to March 14th, the meme coin finally takes a small pullback step.  TradingView
With a 40% pullback to test $0.0000063 from the peak of $0.00001083, the PEPE price finally concludes the downfall with the 27% jump last night. The meme coin forms a morning star pattern with the huge bullish engulfing candle and teases a trend continuation.
As per the trend-based Fibonacci levels, the frog-themed altcoin could break the $0.000010 barrier once again. Optimistically, the breakout rally can lead to a jump to $0.000015.
FLOKI Price Reversal Brings Entry Opportunity
Making waves overnight, the FLOKI price showed a massive jump of 31% last night, creating a huge bullish engulfing candle. The uptrend continues today with an intraday move of 6.63% and is ready to cross the $0.00025 mark.  TradingView
Taking support from the long-coming ascending trendline, the meme coin takes off with multiple green candles. Completing the correction phase of 40% in just a week, the FLOKI price shines again.
Considering the trend momentum sustains, the meme coin could scale to the $0.00043 mark before challenging the psychological mark of $0.00050.
Price Analysis