Trendlines İndicators part2

Strengths & Weaknesses
Long Term: Up-Trends
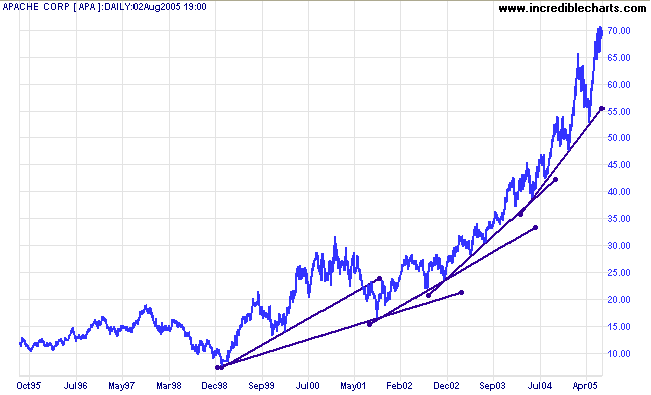
Linear trendlines appear to accelerate over time if a stock grows at a constant compound rate.
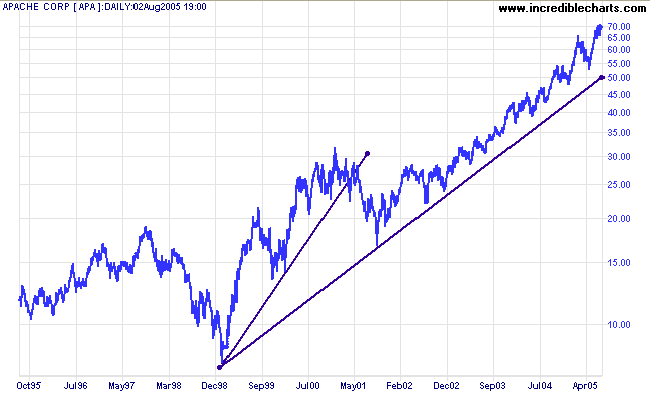
Logarithmic trendlines more accurately present the rate of growth (or decline) over very long time periods.
Long Term: Down-Trends
Linear trendlines appear to decelerate over time if a stock declines at a constant (negative) growth rate.
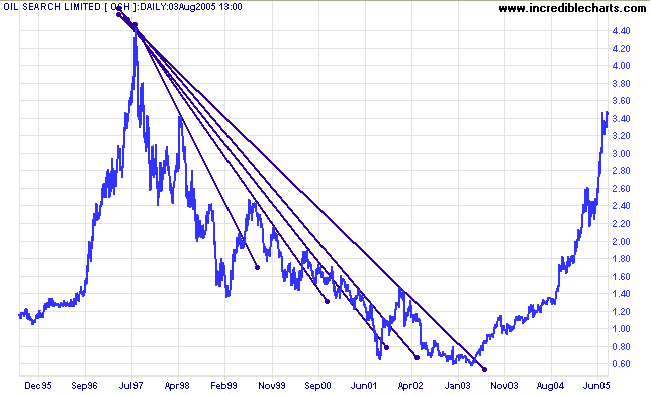
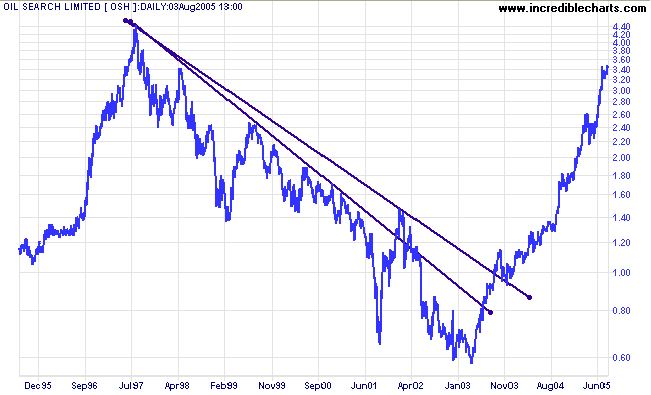
Logarithmic trendlines more accurately present the rate of decline.
Short/Medium Term
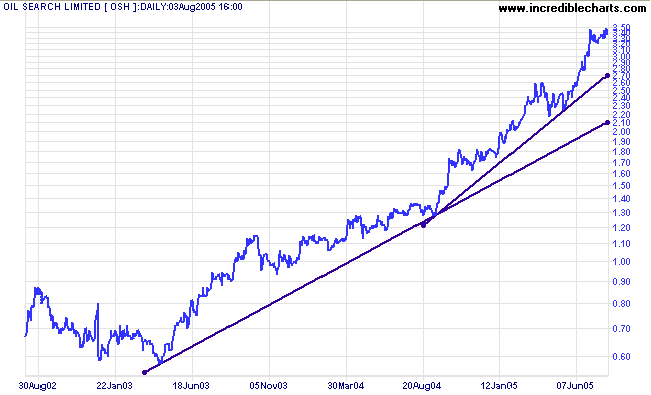
Logarithmic trendlines tend to disguise accelerating trends in the short/medium term. We are talking about accelerating trends rather than a steady growth rate. Accelerating trends normally end up in blow-offs (or cathartic sell-offs in a down-trend) followed by a sharp reversal.
On a 3-year chart, normal scale highlights the accelerating trend.
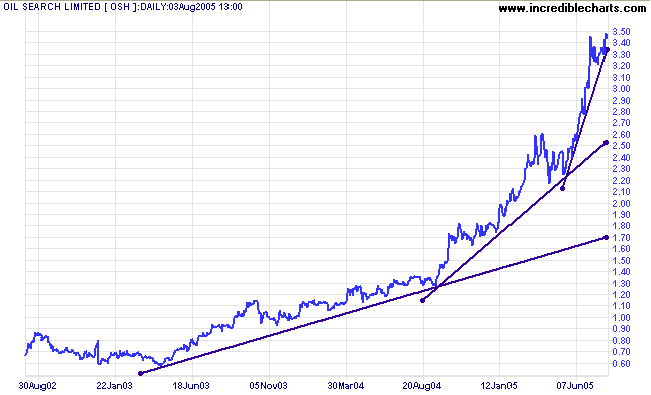
While log scale tends to camouflage (flatten) the acceleration.
Drawing Trendlines
Let's take a look at some of the basics in more detail.
Trendlines Must Be Respected At Least Three Times
What do we mean by respect? Price should reverse in close proximity to the trendline but not cross it. Take the Allegheny Energy chart, from earlier, as an example:
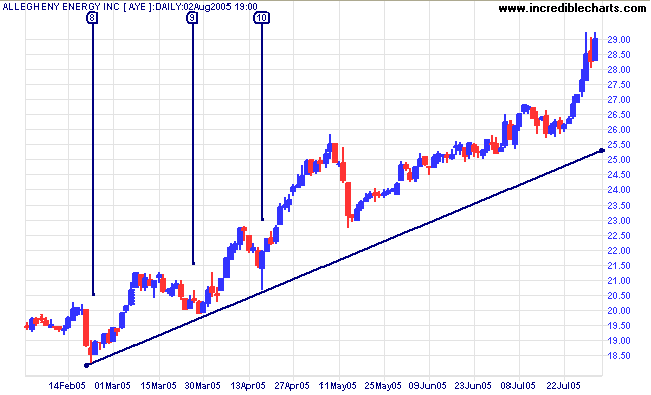
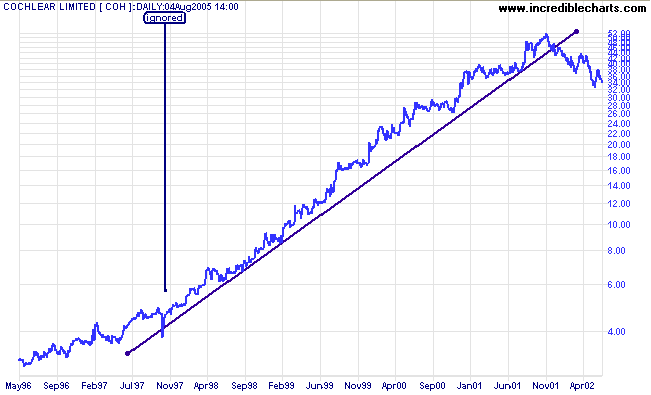
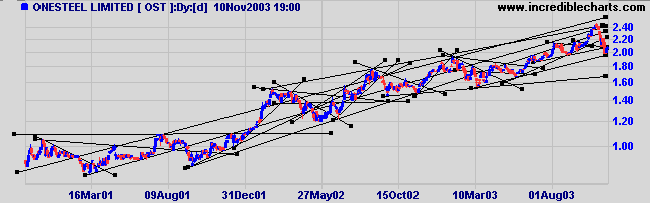
What does close proximity mean? Price does not have to touch the trendline. Any reversal within a reasonable distance is good enough. On the 3-year chart below you can see that a number of troughs are short of the trendline, but within close enough proximity that they can be said to have respected the trendline.
Trendlines Should Not Intersect Price
Short-term charts often display candles with long tails or shadows when stops are shaken out, or traders get caught in a false break, initiated by market professionals. If the daily high or low gets in the way of an obvious trendline -- ignore it, but do not intersect closing prices.
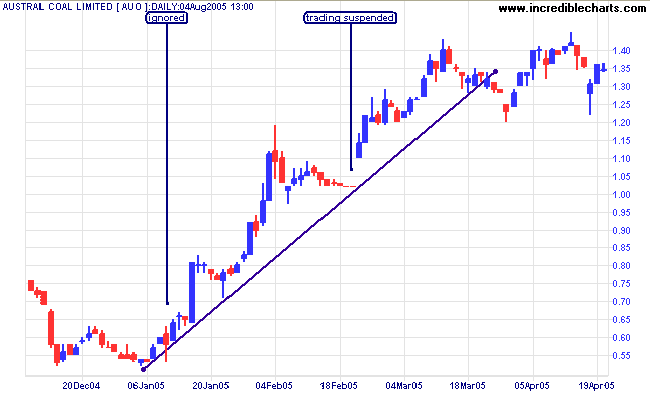
Trading was suspended, on the above chart, for two days in February. Longer suspension periods may distort trendlines and the results should be treated with caution.
Avoid intersecting closing price except on a long-term chart if there is a spike that does not fit the overall pattern. And only do so in exceptional circumstances: the trend must really be obvious.
Trading Signals
Trendline breaks signal a change in momentum; not necessarily a change in trend. Trendline breaks often look obvious with hindsight, but you will normally find that the trendline depicted was not the first one drawn: several trendlines may be broken before there is a trend reversal.
When should Trendline breaks be acted upon?
- If trading short-term or swing trading, act upon trendline breaks when you receive price confirmation (or confirmation from another indicator), as you would for any other momentum indicator.
- In the longer-term, trendlines are an effective tool for exiting trends that have spiked into a blow-off (or down-trends that have spiked into a cathartic sell-off).
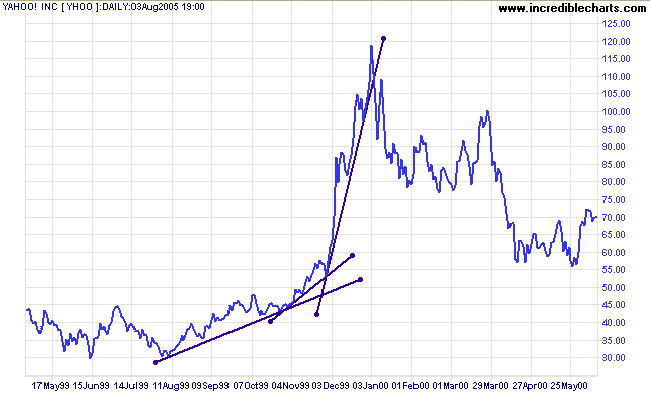
Blow-offs
A fast accelerating trend, or blow-off, is normally identified by at least 3 accelerating trendlines, each at a markedly steeper gradient than the previous one. Yahoo displays a classic example in 1999/2000.
Normal Long Term Breaks
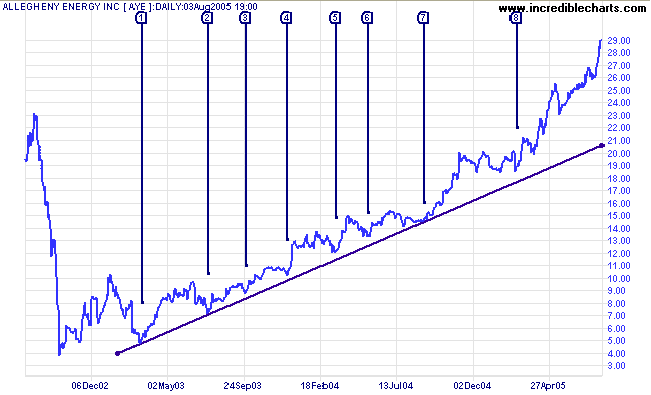
Normal trendline breaks on long-term charts should be treated as an alert rather than as a trend reversal signal.
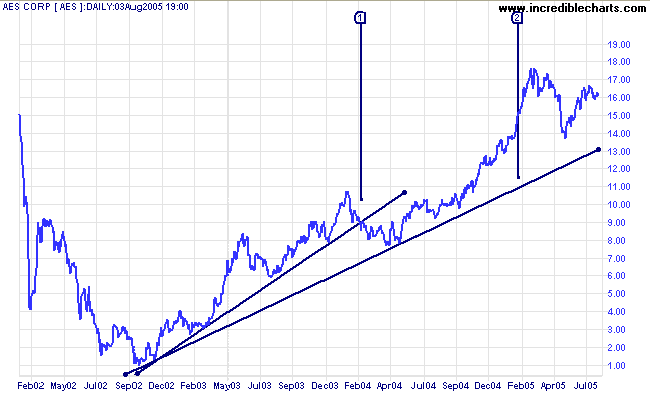
- The first trendline drawn after an inverted head and shoulders is broken at [1] signaling that momentum is slowing;
- Price tests support at $8.00 several times before resuming the up-trend, establishing a second trendline at [2].
- If the up-trend continues, we may draw a third trendline: through the low at $8.00 and the low at $14.00
Quick TestHas trendline [2] above been confirmed yet?
Hint: Valid trendlines must be respected at least three times.
Tick here for the Answer:
When to Use Trendlines
Drawing trendlines is time-consuming and in most cases unnecessary. Use stock screens to identify the most likely candidates and concentrate on these. Following more than 20 stocks with trendlines is, in my opinion, a waste of time.
Another Pitfall
You have to look at the wood not the trees!
With thanks to AndrewK.
Summary
Draw trendlines through the lows in an up-trend and through the highs in a down-trend. Use closing price for longer-term charts (more than 6 months). Use normal scale for short and medium-term charts. Use either normal or log scale for long-term charts but beware of their weaknesses.
Valid trendlines must be respected by at least 3 troughs in an up-trend (or 3 peaks in a down-trend) and should not intersect the closing price line if extended in either direction. Use trendlines as a momentum indicator for short-term trades but only as an alert on long-term trades. They are also an effective exit tool for blow-offs.
Don't waste time drawing trendlines on every chart. They are time-consuming and should only be drawn on a handful of selected stocks.