Lost Treasure Found? Bitcoin Miner Transfers Over $3 Million BTC After 14-Year Dormancy

According to the on-chain analysis platform Lookonchian, a long-dormant Bitcoin (BTC) wallet dating back to April 2010, recently transferred 50 BTC, equivalent to $3.328 million.
Related Reading: Breaking: Spot Bitcoin And Ethereum ETFs Approved In Hong Kong
Unraveling The Transaction: An Exploration of Potential Motives
As reported by Lookonchian, 50 BTC mined over 14 years ago, when each block reward was 50 BTC, was divided into two transactions: 17 BTC ($1.1 million) for one wallet and 33 BTC ($2.2 million) for another.
The recipient wallet receiving 17 BTC has shown patterns of frequent transactions, possibly indicating its association with a cryptocurrency exchange, particularly Coinbase.![]()
The analysis further reveals that the Bitcoin sent to this wallet was subsequently merged with funds from other wallets associated with Coinbase, suggesting a possible deposit into the exchange.
A miner wallet woke up after being dormant for nearly 14 years and deposited 50 $BTC($3.28M) to #Coinbase 5 mins ago.
The miner earned 50 $BTC from mining on Apr 23, 2010, and has been holding it to this day.
Address:
15sxzZ4QSaoiMo5KYH9ab4xQj34yeJmKgb pic.twitter.com/DRw9U5Xy8N
— Lookonchain (@lookonchain) April 15, 2024
On the other hand, the remaining 33 BTC were transferred to a new wallet. This could indicate that this Bitcoin may have effectively remained within the miner’s control but under a new address, a common practice to enhance transaction privacy.
Bitcoin Recovery Amid Impending Halving
This recent activity coincides with Bitcoin’s rebound following a sharp decline that saw its price plummet from over $70,000 to $62,000 over the weekend. However, at the time of writing, Bitcoin is trading at $64,109, marking a 0.5% increase in value over the past 24 hours.BTC price is moving sideways on the 4-hour chart. Source: BTC/USDT on TradingView.com
This surge in price comes amidst anticipation of the upcoming Bitcoin Halving scheduled to take place in the next 5 days on April 20.
Notably, the Bitcoin Halving is a programmed event that occurs approximately every four years or after every 210,000 blocks are mined. Bitcoin miners’ reward for validating transactions and securing the network is cut in half during this event.
When Bitcoin was launched in 2009, the reward was initially set at 50 BTC per block. However, the reward has been halved, reducing the rate at which new BTC is created. This adjustment is designed to control the supply of Bitcoin, making it more scarce over time and ultimately contributing to its deflationary nature.
Furthermore, recent reports indicate that BTC miners could face losses exceeding $10 billion due to the upcoming Halving event. As Bloomberg reported, this loss could result from several factors, including miners facing intensified competition from AI companies.
Related Reading: Bitcoin Bonanza Before The Halving? Analyst Sees Pre-Crash Buying Window
Core Scientific CEO Adam Sullivan noted the tightening availability of power in the US, driven partly by tech giants like Amazon investing heavily in data centers. This competition for resources presents further obstacles for miners seeking affordable power contracts.
Featured image from Unsplash, Chart from TradinView
Disclaimer: The article is provided for educational purposes only. It does not represent the opinions of NewsBTC on whether to buy, sell or hold any investments and naturally investing carries risks. You are advised to conduct your own research before making any investment decisions. Use information provided on this website entirely at your own risk.
Tags: bitcoinBitcoin Halvingbitcoin minerbtcBTCUSDTcryptohalving
Bitcoin Whales Showing Different Behavior From Past Cycles, But Why?
On-chain data suggests the Bitcoin whales have been showing different behavior regarding exchange inflows from the last cycle. Here’s why this may be so.
Bitcoin Whales Are Showing Different Behavior In Exchange Inflows This Time
As an analyst explained in a CryptoQuant Quicktake post, the BTC whales’ movements have been different this time compared to the previous cycle.
The indicator of interest here is the “exchange inflow,” which tracks the total amount of Bitcoin being transferred to wallets attached to all centralized exchanges. In the context of the current discussion, derivative platforms are specifically of interest.![]()
Related Reading: PEPE Preparing For A 54% Move? Analyst Thinks So
When this metric’s value is high, it means that investors are depositing large amounts on these exchanges. Such a trend usually suggests a high demand for the services these derivative exchanges provide.
Generally, extraordinary spikes in the indicator are associated with whale movements, given that only these humongous holders can cause such large shifts.
On the other hand, when the metric has a low value, it suggests that the whales aren’t depositing anything significant to these platforms, a possible sign that they don’t want to take risks on the derivative side.
Now, here is the chart shared by the quant, which shows the data for the Bitcoin exchange inflow for derivative exchanges:
The value of the metric seems to have been relatively low in recent days | Source: CryptoQuant
The indicator in the above graph also has another condition attached: it only tracks the inflows coming from the whales that had been holding for at least 1 month and at most 3 months.
These would be the newbie whales in the market, but not quite so new that they have only bought (those with a holding time of less than 1 month). Restricting this time range also excludes the data of the traders who make a high amount of moves in short timeframes on average.
As the analyst has highlighted in the chart, the whales in this group have usually made large inflows to derivative platforms around notable cryptocurrency tops and bottoms, when speculation is at its height.
Interestingly, though, the cryptocurrency has witnessed no such large inflow spikes this year even though the asset has broken past the previous all-time high (ATH).
One explanation may be that the whales are not interested in making any real moves right now. However, a more likely reason may be that spot exchange-traded funds (ETFs) exist now.
The spot ETFs hold Bitcoin on behalf of their customers and let them gain indirect exposure to the cryptocurrency in a way familiar to conventional investors.
Related Reading: Dogecoin Usurped: These Memecoins Overtake DOGE In Active Trader Count
The ETFs have brought significant demand into the asset and have quickly become an important part of the market. It’s possible that, with this new investment vehicle, the usual cryptocurrency exchanges no longer have the same relevance for the asset.
This could be why the pattern that held during the previous BTC cycle has seemingly disappeared from the current one.
BTC Price
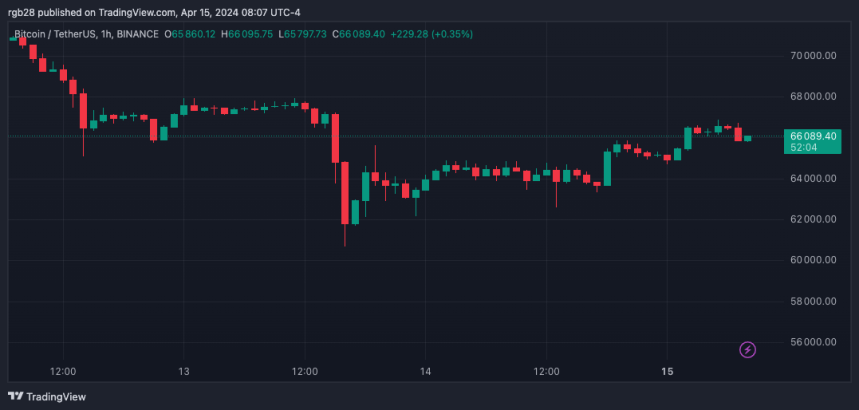
At the time of writing, Bitcoin is trading at around $66,100, down more than 8% over the past week.
Looks like the price of the asset has overall moved sideways recently | Source: BTCUSD on TradingView
Featured image from Bart on Unsplash.com, CryptoQuant.com, chart from TradingView.com
Disclaimer: The article is provided for educational purposes only. It does not represent the opinions of NewsBTC on whether to buy, sell or hold any investments and naturally investing carries risks. You are advised to conduct your own research before making any investment decisions. Use information provided on this website entirely at your own risk.
Tags: bitcoinBitcoin BehaviorBitcoin CycleBitcoin Exchange InflowBitcoin Selling
Analysts Bullish On Bitcoin Despite Peter Schiff’s $20,000 Doom Scenario

Over the weekend, the Bitcoin (BTC) crash had the crypto community on its toes. With the price dropping to $60,000, many investors worried that the flagship cryptocurrency was in trouble ahead of the “Halving” event.
Amid the correction, Bitcoin critic Peter Schiff claimed that his previous predictions regarding spot Bitcoin ETFs (exchange-traded funds) were correct and presented the possibility of a doom drop for BTC.
Related Reading: Breaking: Spot Bitcoin And Ethereum ETFs Approved In Hong Kong
Peter Schiff’s Doomsday Prediction For Bitcoin
Back in March, known Bitcoin opposer Peter Schiff asserted what he thought was the problem with Bitcoin ETFs. According to the economist, the problem with owning these investment products was that liquidity was limited to US market hours, which would mean that investors could not sell if the market crashed overnight.![]()
As I warned if #Bitcoin starts selling off tonight, #BitcoinETF owners can do nothing but watch and wait until the NYSE opens tomorrow morning. In the meantime it will be a long night hoping that Bitcoin doesn't crash before they have a chance to sell. https://t.co/GfLtl6Wc1S
— Peter Schiff (@PeterSchiff) April 14, 2024
On Sunday afternoon, Schiff claimed that, as he previously warned, Bitcoin ETF owners would be helpless if the flagship cryptocurrency started selling off that night. BTC traded around $63,460 at the time of his post and recovered in the following hour to trade above the $65,000 support level.
Earlier that day, Schiff had warned of a critical support zone for BTC. To the economist, breaking below $60,000 could “create a formidable triple top.” This trend reversal could lead to an “immediate downside projection” of $20,000.
Following his dooming scenario, Schiff stated that, at that price, MicroStrategy would “have a $2.7 billion unrealized loss on 214K Bitcoin acquired at an average price of $34K.” Additionally, he believes that BTC’s price could increase “before it crashes.”
Analysts Unfazed By BTC’s Correction
Several analysts concurred that the correction was a “minor drop” in the macro picture. According to MacroCRG, Bitcoin’s chart “looks incredible.” The analyst stated: “They threw a full-on war at her and all it managed to do was wick the range low.”
Similarly, trader and analyst Rekt Capital considers that BTC “successfully protected the Range Low of its Re-Accumulation Range as the week of the Bitcoin Halving begins.”
Per the analyst’s chart, Bitcoin is at the “Last Pre-Halving Retrace” during the “Pre-Halving Rally.” If history is to repeat itself, after April 19, BTC will enter the “Re-Accumulation” phase before experiencing the “Post-Halving Parabolic Upside.”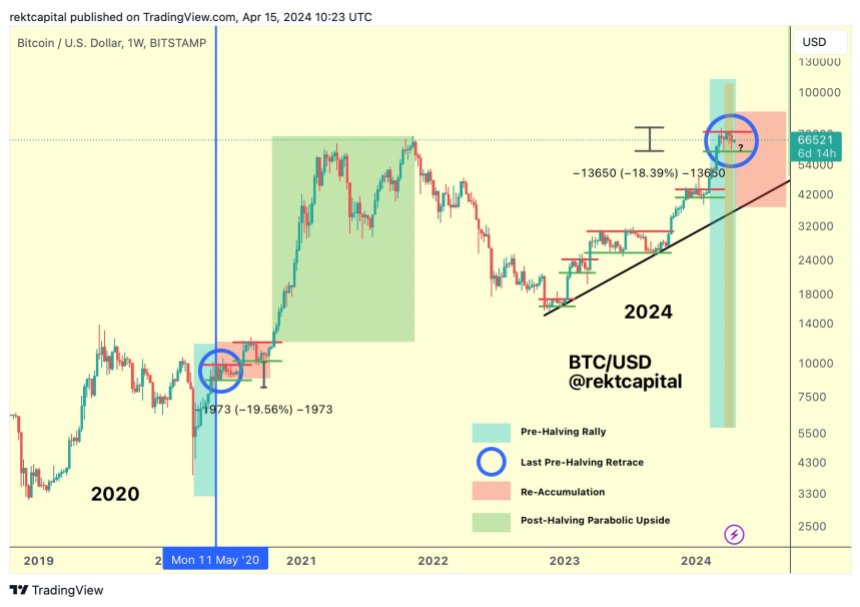
Bitcoin phases during the "Halving" event. Source: Rekt Capital on X
Moreover, Crypto Jelle urged investors to “not get shaken out” as BTC is “consolidating above the previous cycle highs.” The analyst and investor reaffirmed his prediction of $82,000 after the upcoming “Halving” event.
However, Jelle also set a higher target for this bull cycle. The bullish megaphone pattern on BTC’s chart “still has a pattern of $180,000” despite the recent correction, as stated in the post. The analyst claims he wouldn’t be surprised “if the meme pattern plays out once again.”
The correction caused BTC to register bleeding numbers for several periods. The biggest cryptocurrency exhibits an 8.4% and a 3.1% dip in the weekly and monthly timeframes. Similarly, BTC’s market activity has decreased by 32.1% in the past day, with a trading daily volume of $42.56 billion.
Nonetheless, Bitcoin has recovered 3.5% from its price 24 hours ago, currently trading at $66,275. Since the lowest point of this correction, BTC has surged 10.3%.
Related Reading: Bitcoin Price Downside Thrust Over Or The Bears Are Not Done Yet?
Bitcoin's performance on the three-day chart. Source. BTCUSDT on TradingView
Featured Image from Unsplash.com, Chart from TradingView.com
Disclaimer: The article is provided for educational purposes only. It does not represent the opinions of NewsBTC on whether to buy, sell or hold any investments and naturally investing carries risks. You are advised to conduct your own research before making any investment decisions. Use information provided on this website entirely at your own risk.
Tags: bitcoinbitcoin analystBitcoin correctionbitcoin pricebtcBTCUSDT
Dogecoin Flashes Weekly Golden Cross: Why This Analyst Believes The Bull Rally Is Far From Over
A crypto analyst known as Yomi has noted that the Dogecoin recent price action could turn bullish after this week. According to Yomi, DOGE is on the verge of creating a golden cross on its price chart, an event that could indicate the continuation of a major bull run. He noted the need for a green candle this week in order to start a new rally, which could be tough considering recent on-chain metrics and market fundamentals.
Dogecoin Flashing Weekly Golden Cross
The weekly chart for Dogecoin is flashing a golden cross, a bullish signal that occurs when the 50-week moving average crosses above the 200-week moving average. According to a weekly price chart shared by Yomi, this weekly cross looked almost completed just two weeks ago, as a price surge for DOGE in the past two months saw the short-term moving average approaching the longer one.
Related Reading: Will The Halving Send Bitcoin Price To $100,000? Analytics Platform Reveals What You Should Expect
However, trader sentiment around DOGE has turned bearish since the beginning of April as the bulls struggled to push the crypto past the $0.22 mark, allowing it to form a price resistance level. Consequently, DOGE has gone on to form two weeks of bearish candles, which has derailed the completion of a golden cross. ![]()
Update on #Dogecoin pending weekly Golden Cross. We are still multiple weeks of upward price action away from achieving this bull market milestone. 2 red weeks in a row have cause us to deviate slightly also. Need green soon to get back on track! #DOGE #Altcoins pic.twitter.com/QfdFSR24Uc
— Yomi (@OG_Yomi) April 15, 2024
Yomi observed that the formation of this bullish indicator has been pushed forward to multiple weeks of upward price movement. Furthermore, Yomi said all that’s needed is for DOGE to close higher than its open price this week and form a green candle to confirm the breakout and get back on track to a golden cross.
DOGE To Turn Bullish?
Dogecoin dropped by an astounding margin last week to spearhead the crash in the majority of meme coins. Interestingly, the crypto fell to as low as $0.13 in the middle of the week, representing a 33% decline from its opening price at the start of the week. During the price fall, crypto whale transaction tracker Whale Alerts noted the transfer of 600 million DOGE tokens worth $92.3 million from a private wallet into Binance, hinting at a potential sell-off from a DOGE whale.
Related Reading: Bitcoin ETF Issuers Push Holdings To 4.27% Of BTC Supply Amid Crash To $61,000
However, all is not lost as Dogecoin price action has been showing green in the past day. At the time of writing, DOGE is trading at $0.1669, up by 5% in the past 24 hours. If DOGE can close substantially above its weekly open of $0.1624, that would confirm the continuation of the journey to a golden cross and likely kick off a new uptrend.
Yomi noted in another post on social media that Doge will continue to tease a bullish price action in the longer term as long as it stays above $0.12 this week.
DOGE price at $0.164 | Source: DOGEUSDT on Tradingview.com
Featured image from U Today, chart from Tradingview.com
Disclaimer: The article is provided for educational purposes only. It does not represent the opinions of NewsBTC on whether to buy, sell or hold any investments and naturally investing carries risks. You are advised to conduct your own research before making any investment decisions. Use information provided on this website entirely at your own risk.
Tags: analystcryptocrypto analystcrypto newsdogeDOGE newsDoge price