Trendlines İndicators part1

Trendlines
A trendline (sometimes hyphenated as "trend-line") is simply a momentum indicator. It measures the rate of increase in the share price over time and alerts you to any acceleration or deceleration of the trend. The difference between trendlines and other momentum indicators is that you use a super-computer (the human brain) to visually identify the trend, rather than a simplistic formula calculated on your PC.
Trendline Basics
- Draw trendlines through the lows of an up-trend — and through the highs of a down-trend;
- On long-term charts, draw trendlines through closing prices;
- Use either normal or log scale charts but be aware of their respective weaknesses;
- Trendlines must be respected by at least three lows (or highs in a down-trend) — if respected twice, the trendline is not yet confirmed;
- Trendlines should not intersect (cut across) price at any point on the chart if extended.
Support and Resistance
Trendlines do not predict levels of support and resistance. Support and resistance run horizontally; not at an angle. For an explanation of the basics, see Support and Resistance. Many traders confuse the two concepts: the lower line in a trend channel is often referred to as the supporting trendline.
Highs or Lows
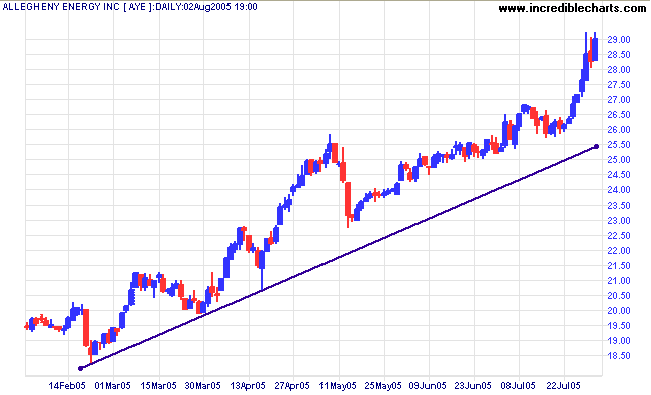
On a short-term chart (6 months or less), draw trendlines through the lows during an up-trend.
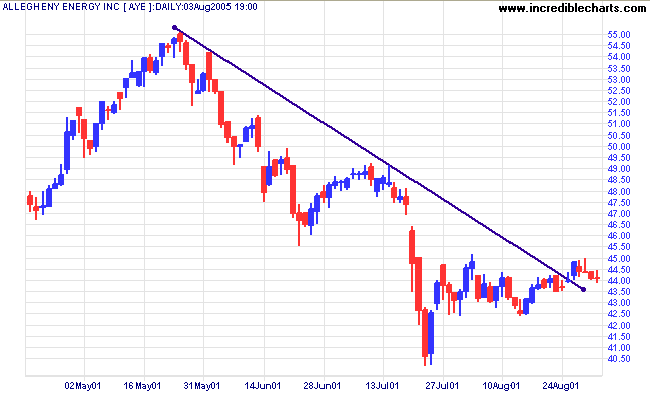
And through highs during a down-trend.
Closing Price
On a long-term chart, trendlines drawn with closing price are more effective.
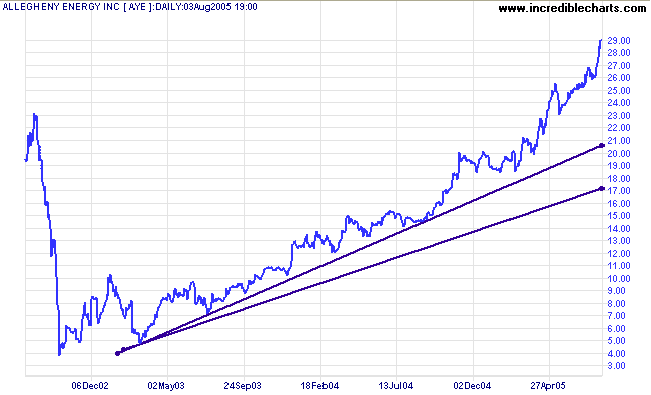
The lower trendline was drawn according to daily lows, to illustrate this point.
Log or Normal Scale?
There has been much debate over the years as to whether trendlines should be drawn on log scale or normal scale charts.
The case for log scale was summarized by Alsoran as:
- Brokers and analysts chart in log mode. They advise institutional clients whose order flow has a marked impact on price action and trend. Their advice is heavily influenced by breaks and refusals of price at key trendlines and channels. These are based on logarithmic charts. Logarithmic trendlines are, therefore, more important.
The case for normal scale (linear) trendlines:
- Most trading authors use linear charts: Stan Weinstein, Alexander Elder, Chris Tate and Daryl Guppy.
- It is questionable whether most analysts and brokers use log scale charts. Many trading authors (including Stan Weinstein and Chris Tate) are former analysts or brokers and use linear charts.
In my opinion the two sides are talking about different time frames!
Normal Scale
Normal scale charts compare price against time. You would graph the speed of a car in a similar manner: distance (y) over time (x). If a car travels at a constant velocity, the graph will be a straight line. If stopped, the line will be horizontal. If accelerating, the graph will show a curve.
Log Scale
Log charts are not designed to measure velocity, they measure acceleration: the rate of growth in stock prices. A constant velocity will be depicted as a flattening curve; a constant rate of growth (acceleration) will be depicted as a straight line.
Short Term
In the short/medium term we focus on velocity: "Is this week's price increase as good as last week?" The time period is too short to be concerned with compound growth rates.
Long Term
Most institutions hold stocks for the long-term and do not concern themselves with short-term fluctuations. They want to know the annual compound growth rate; a very different concept from short-term velocity.
What Chart Scale Should I Use?
- On short-term and medium-term charts (3 years or less) we recommend that you use normal scale.
- For long-term charts (more than 3 years), use either normal scale (linear) or log charts, but be aware of their respective strengths and weaknesses. Personally, I prefer to draw trendlines on linear charts unless we are looking at a 10 or 20 year time period.